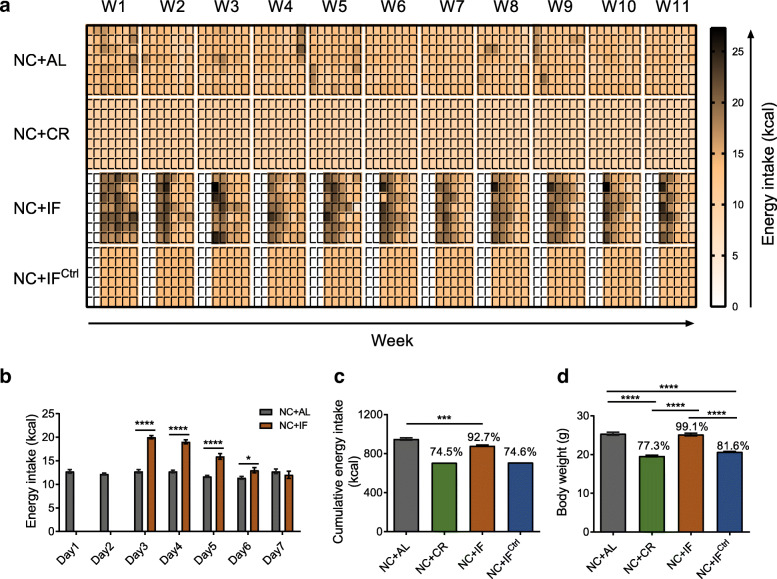
Fig. 1.
Energy intake and body weight in NC-fed mice. a Daily energy intake of NC-fed groups. W, week. b Average energy intake of the NC + IF group during the 11-week intervention compared with that of the NC + AL group. c Cumulative energy intake and d body weights of NC-fed groups after 11 weeks of intervention on day 7 of week 11. Data are presented as the mean ± S.E.M. For each group, n = 6–7. Data were analyzed using the unpaired t test (two-tailed) in b and c. Data were analyzed using one-way ANOVA followed by Tukey post hoc test in d. *P < 0.05, **P < 0.01, ***P < 0.001, ****P < 0.0001

