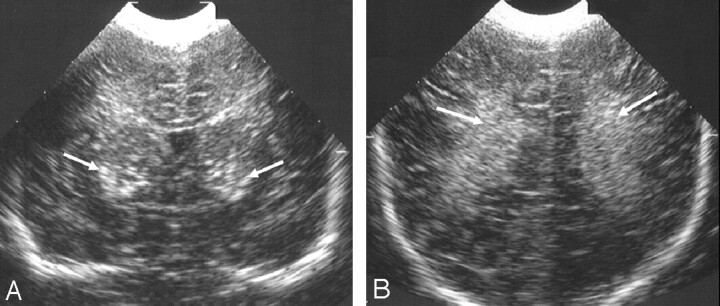
Fig 1.
Ultrasonography images from 1 of 2 siblings with an oxidative phosphorylation disorder.
A and B, Coronal views showing (A) bilateral marked echogenicity in the lower basal ganglia typical of LSV (arrows) and (B) bilateral increased echogenicity in the white matter (arrows). No MR imaging was obtained in this child.

