Fig 2.
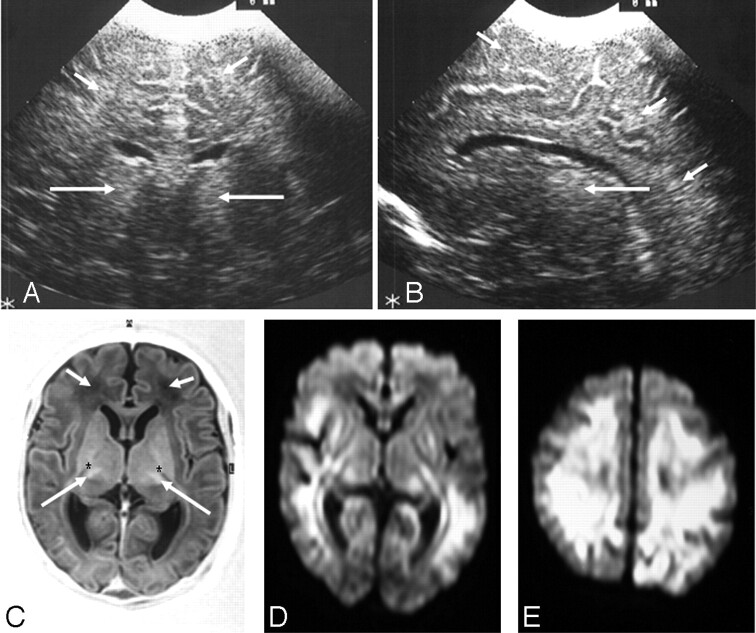
Ultrasonography (A and B) and MR imaging (C–E) (time interval, 3 days) from an infant with a complex III disorder.
A, Coronal view showing bilateral echogenicity in the thalami (long arrows) and diffusely increased echogenicity in the subcortical and periventricular white matter (short arrows). B, Parasagittal view showing an echogenic thalamus (long arrow) and diffusely increased echogenicity in the periventricular and subcortical white matter (short arrows).
C, Axial inversion recovery MR image showing abnormal signal intensity in the thalami (long arrows), absence of normal signal intensity from the internal capsule (*), and abnormal low signal intensity in the white matter (short arrows).
D and E, Axial diffusion-weighted MR images showing widespread abnormal signal intensity in the periventricular and subcortical white matter and in the lateral basal ganglia and posterior thalami.

