Fig 6.
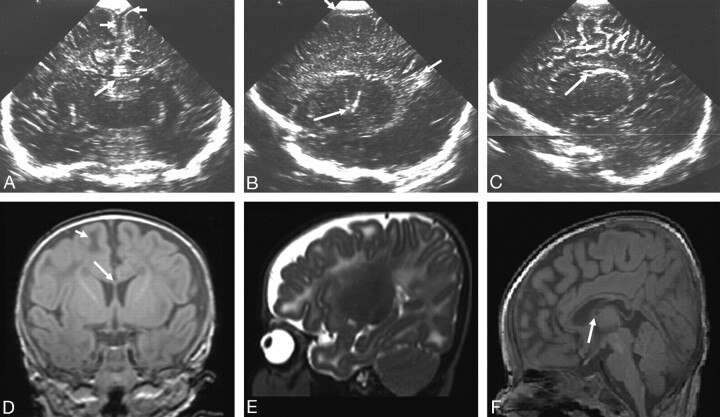
Ultrasonography (A–C) and MR imaging (D–F) (time interval, 35 days) from an infant with argininosuccinic acid lyase deficiency.
A, Coronal view showing a thin corpus callosum (long arrow) and widened extracerebral space and interhemispheric fissure (short arrows).
B, Sagittal view showing LSV (long arrow), increased echogenicity in the white matter most obvious at the trigone (medium arrow), and widened extracerebral space (short arrow).
C, Sagittal view showing a cyst in the choroid plexus (long arrow) and slightly increased echogenicity in the subcortical white matter (short arrows).
D, Coronal T1-weighted MR image showing a thin corpus callosum (long arrow) and low signal intensity in the peripheral white matter (short arrow).
E, Parasagittal T2-weighted MR image showing widespread abnormal signal intensity in the white matter but not the LSV seen on cUS.
F, Midsagittal T1-weighted MR image showing the small cyst (arrow) also seen on cUS.

