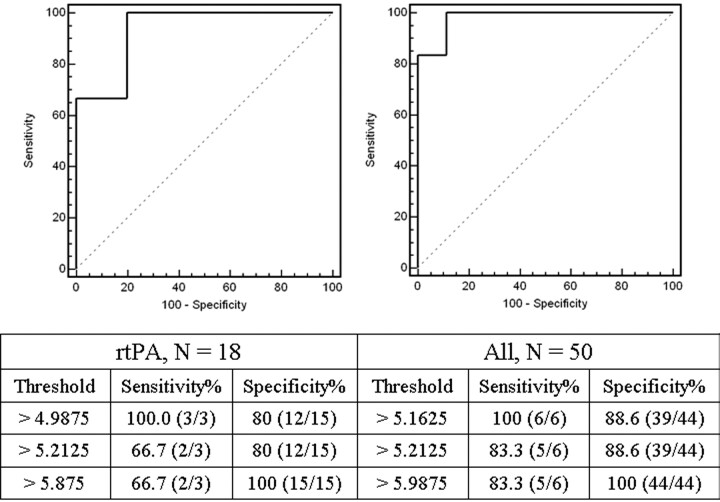
Fig 5.
ROC curves for the rtPA-treated subgroup (left) and the entire cohort (right) with the table of threshold PSinfarct criteria (in units of mL/100 mL per minute) used to generate the curves. For the rtPA-treated subgroup and the entire cohort, the AUC was 0.933 and 0.981, respectively. The data in the non-rtPA-treated subgroup produced an ROC curve with AUC of 1.00 (data not shown), because there was complete separation of PSHT and PSNo-HT (Fig 4).

