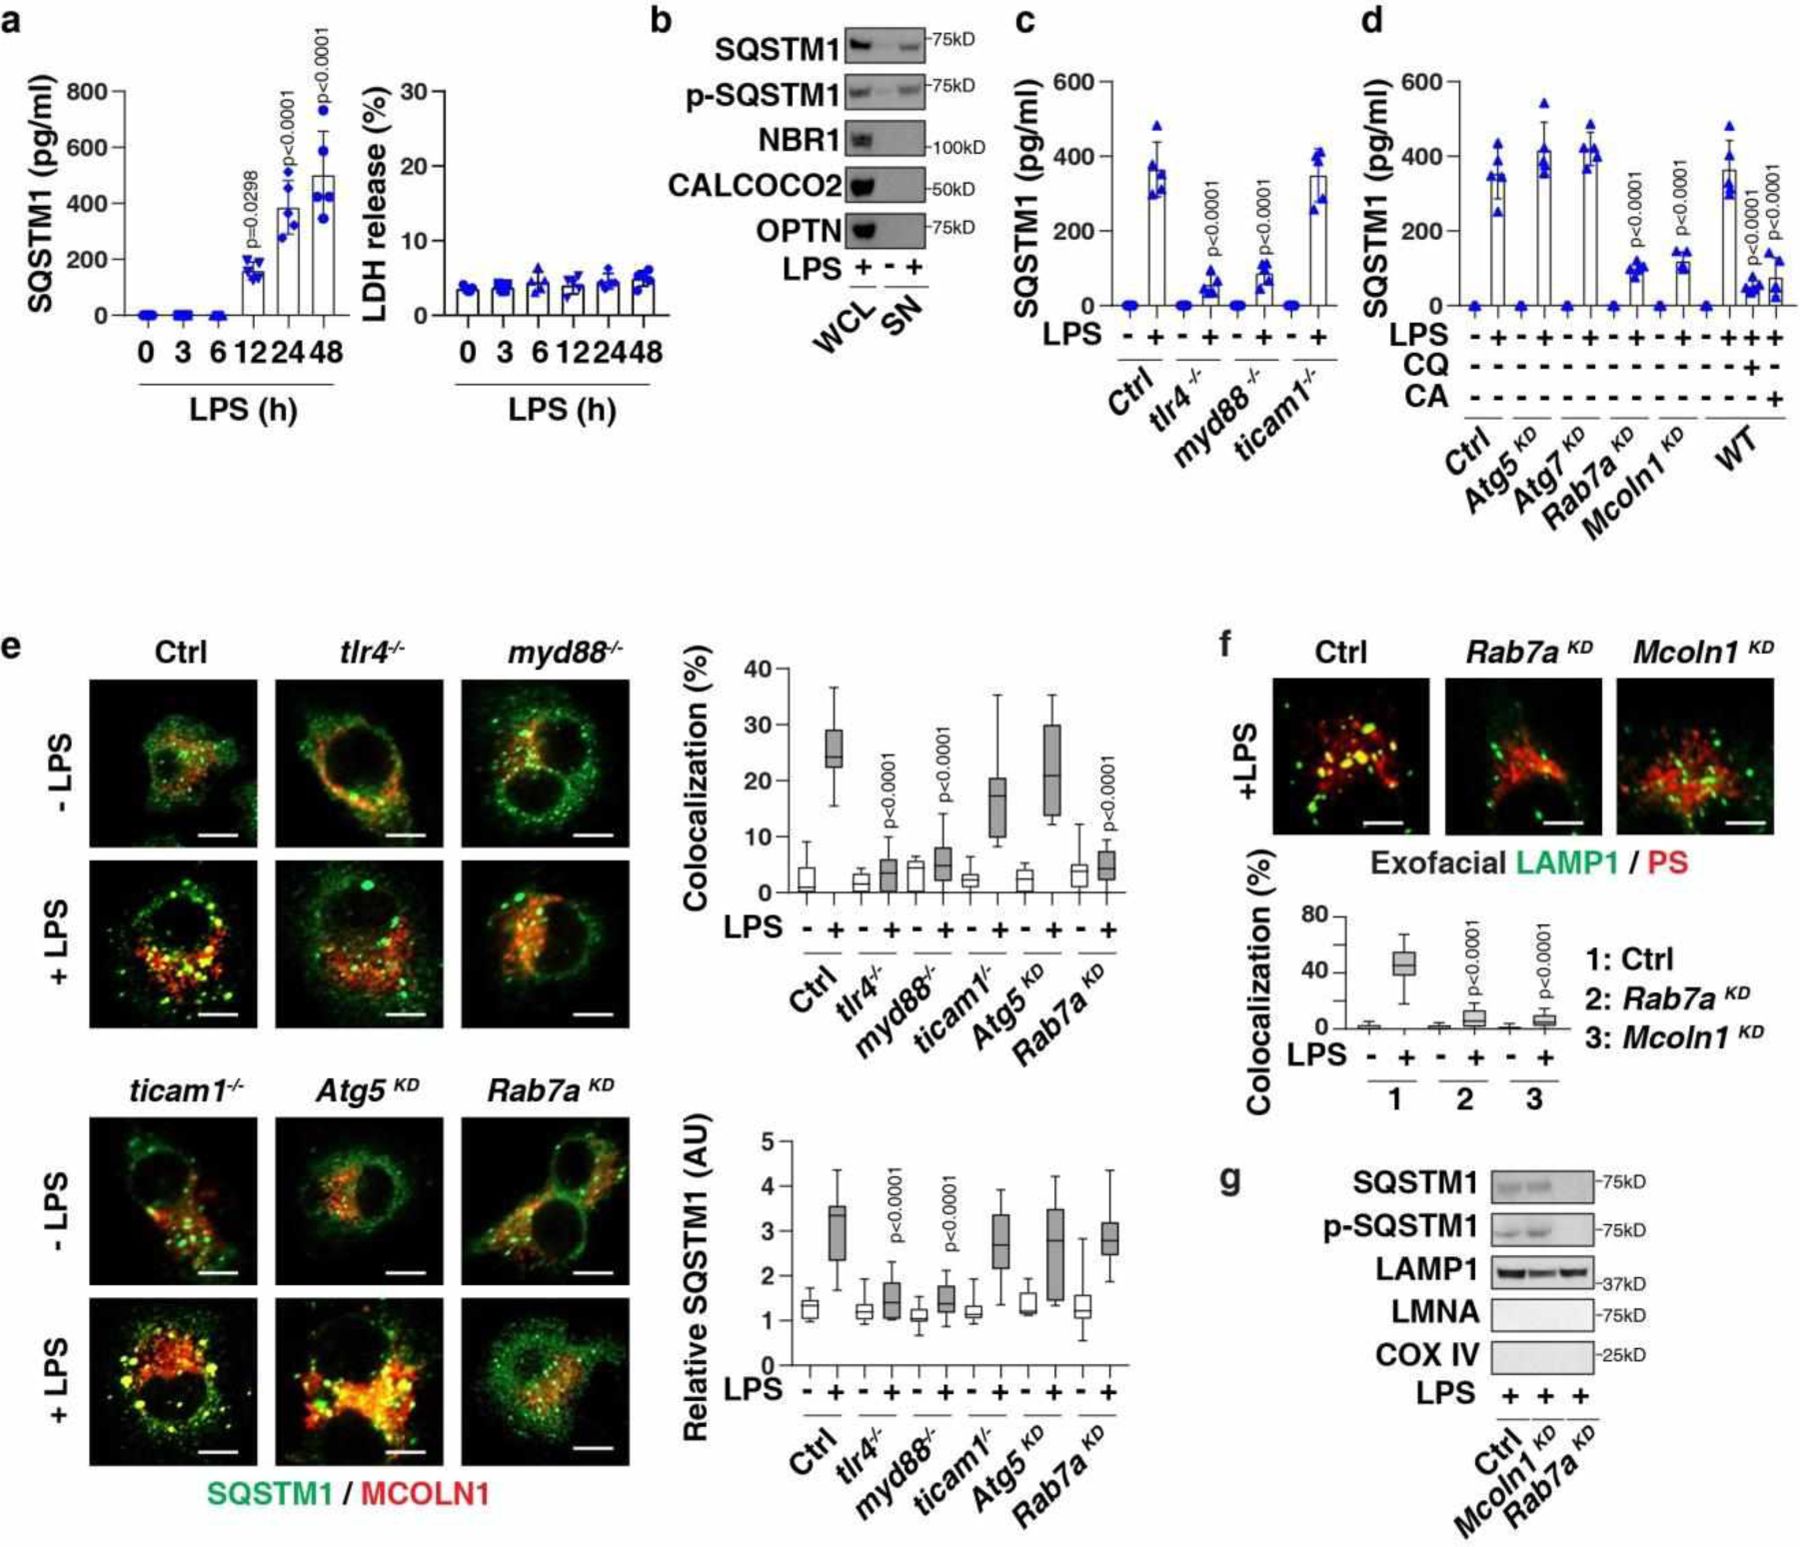
Fig. 1. Activation of MYD88-dependent TLR4 signaling induces the expression and secretion of SQSTM1.

(a) SQSTM1 release and LDH release in LPS-treated BMDMs (n = 5 well /group; one-way ANOVA test, versus control group). (b) Protein levels in whole cell lysate (“WCL”) or supernatant (“SN”) in LPS-treated (200 ng/ml, 24 h) BMDMs. (c) SQSTM1 release in indicated BMDMs following treatment with LPS (200 ng/ml) for 24 h (n = 5 well /group; two-tailed t test, versus control group). (d) SQSTM1 release in the indicated BMDMs following treatment with LPS (200 ng/ml) in the absence or presence of chloroquine (“CQ,” 40 μM) or CA-047Me (“CA”, 40 μM) for 24 h (n = 5 well /group; two-tailed t test, versus LPS-alone group). (e) Analysis of co-localization between SQSTM1 (shown in green) and MCOLN1 (shown in red) in the indicated BMDMs following treatment with LPS (200 ng/ml) for 24 h (n=10 random fields; two-tailed t test, versus control group; bar = 15 μm). (f) Representative images of indicated BMDMs treated with LPS (200 ng/ml) for 24 h and stained for exofacial LAMP1 and exofacial phosphatidylserine (“PS”). The co-localization between LAMP1 and PS was quantified from 10 random fields (two-tailed t test, versus control group; bar = 15 μm). (g) SQSTM1 expression in lysosome-enriched fractions in indicated LPS-treated (200 ng/ml, 24 h) BMDMs. Data in (a), (c), and (d) are presented as mean ± SD. Data in (e) and (f) are presented as median value (black line), interquartile range (box), and minimum and maximum of all data (black line). Data in (e) and (f) are from one independent experiment. Data in (b), (c), (d), and (g) are from two independent experiments. Data in (a) are from three independent experiments.
