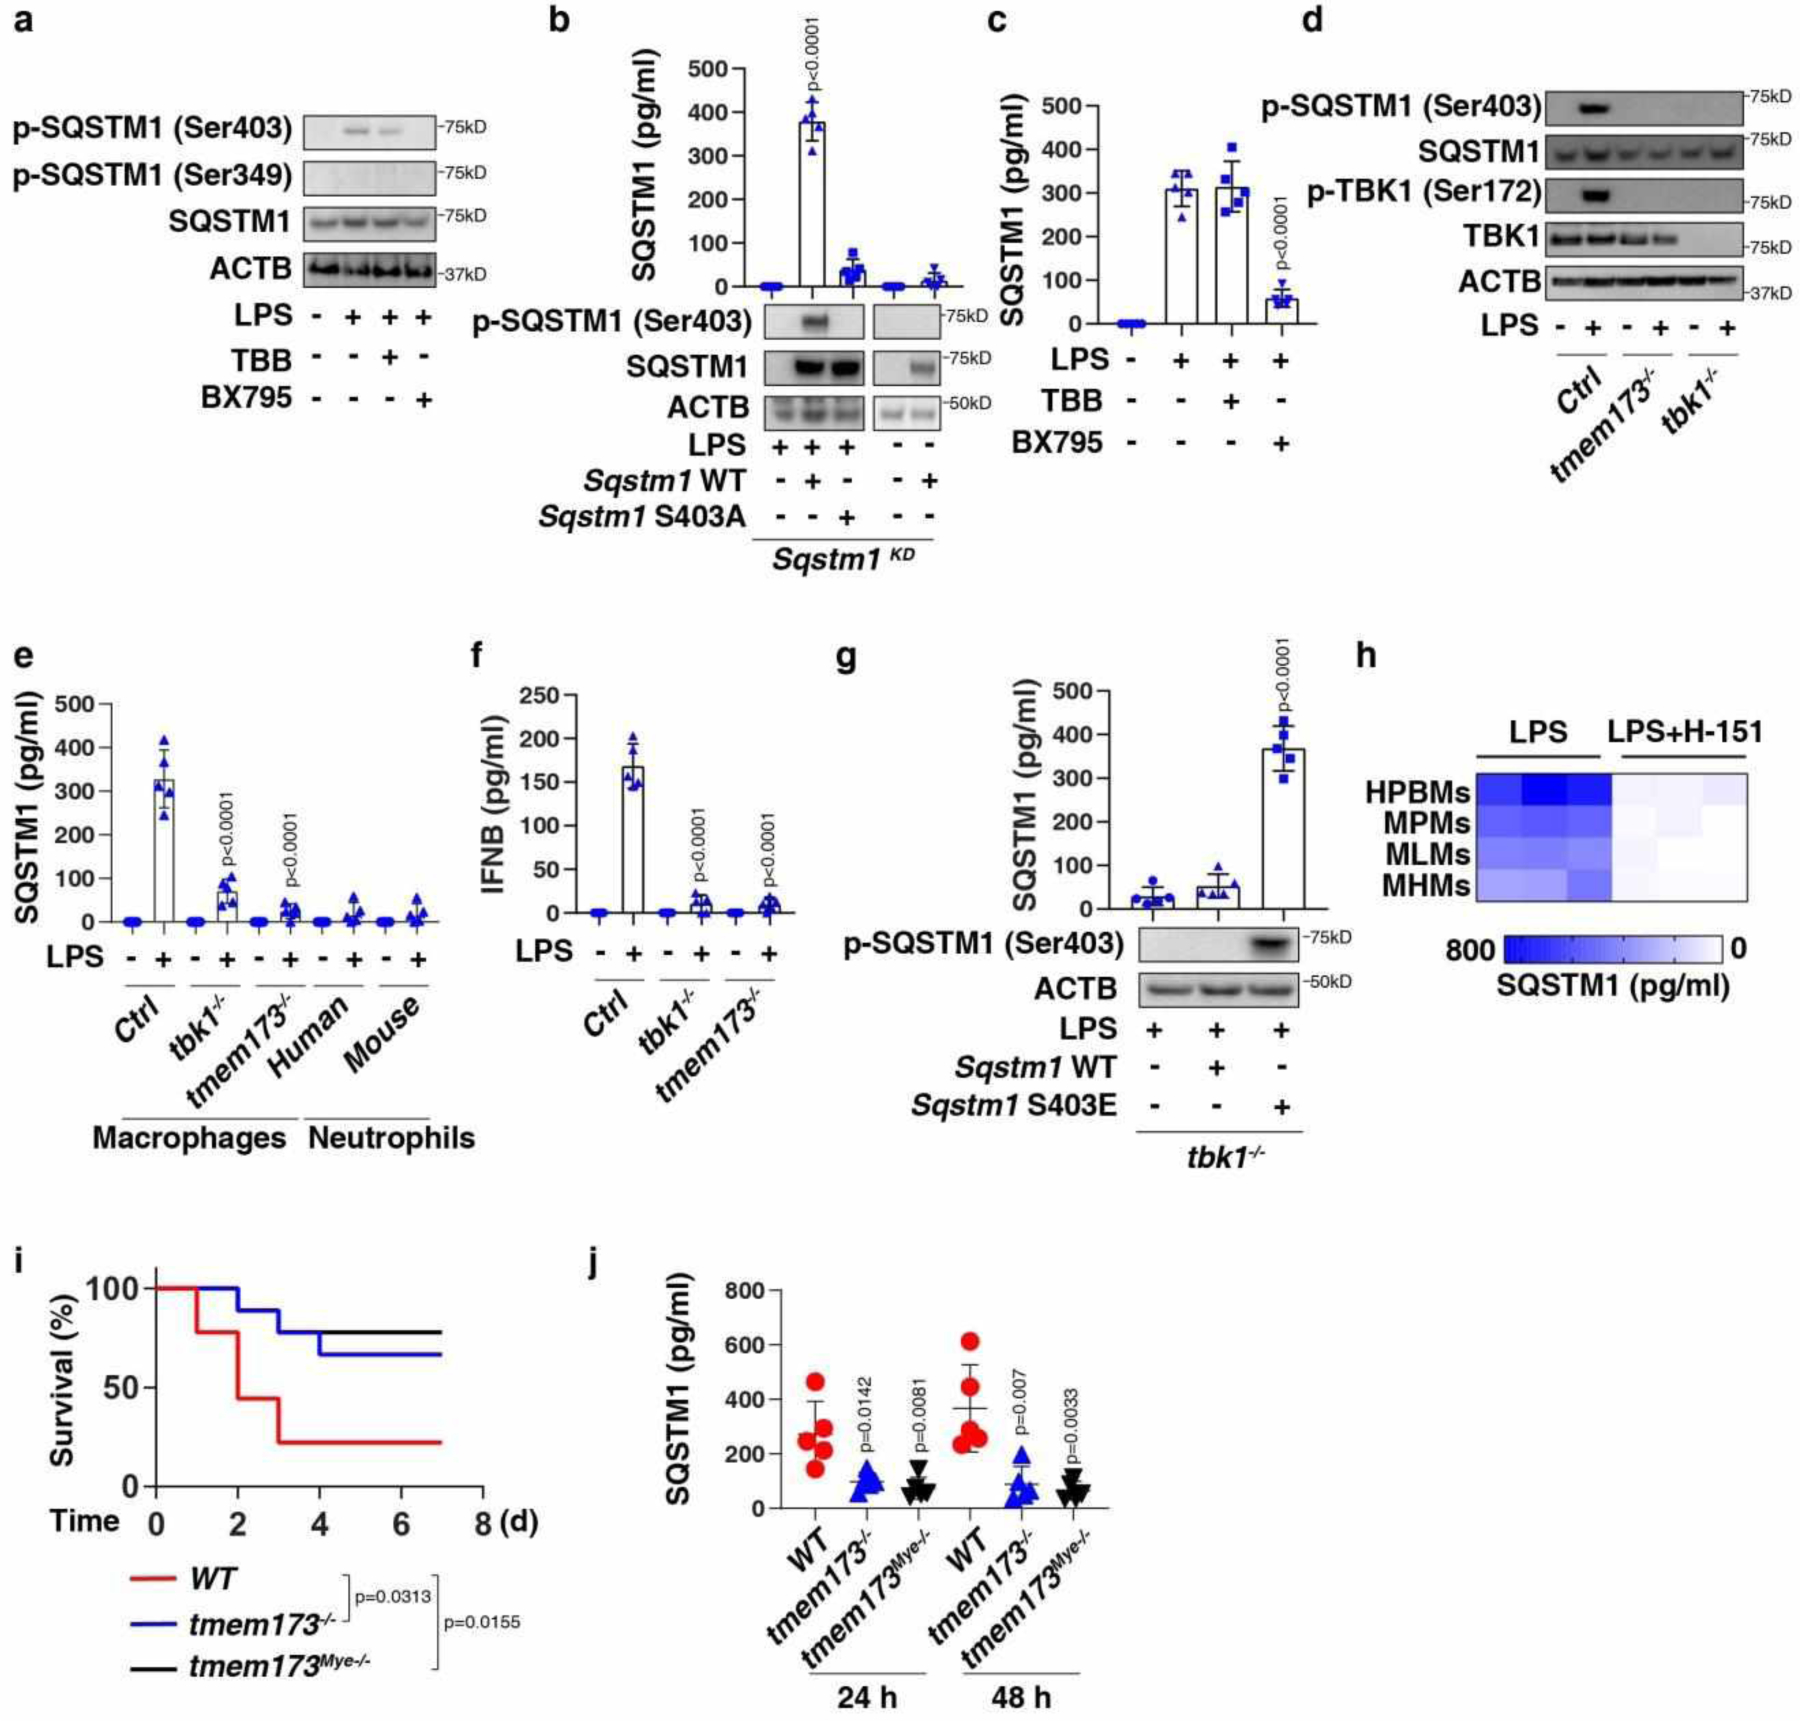
Fig. 2. TMEM173-dependent TBK1 activation mediates SQSTM1 phosphorylation, expression, and secretion.

(a) Western blot analysis of protein expression in BMDMs following treatment with LPS (200 ng/ml) in the absence or presence of TBB (5 μM) and BX795 (5 μM) for 24 h. (b) ELISA analysis of SQSTM1 release in the indicated BMDMs following treatment with LPS (200 ng/ml) for 24 h (n = 5 well/group; two-tailed t test, versus control group). (c) ELISA analysis of SQSTM1 release in BMDMs following treatment with LPS (200 ng/ml) in the absence or presence of TBB (5 μM) and BX795 (5 μM) for 24 h (n = 5 well/group; two-tailed t test, versus LPS-alone group). (d) Western blot analysis of protein expression in the indicated RAW264.7 cells following treatment with LPS (200 ng/ml) for 24 h. (e) ELISA analysis of SQSTM1 release in the indicated macrophages (RAW264.7 cells) or neutrophils following treatment with LPS (200 ng/ml) for 24 h (n = 5 well/group; two-tailed t test, versus control LPS group). (f) ELISA analysis of IFNB release in the indicated RAW264.7 cells following treatment with LPS (200 ng/ml) for 3 h (n = 5 well/group; two-tailed t test, versus control LPS group). (g) ELISA analysis of SQSTM1 release in the indicated RAW264.7 cells following treatment with LPS (200 ng/ml) for 24 h (n = 5 well/group; two-tailed t test, versus control group). (h) Heatmap of SQSTM1 release in the indicated primary human or mouse macrophages following treatment with LPS (200 ng/ml) in the absence or presence of H-151 (2 μM) for 24 h. (i) Depletion of Tmem173 in mice (tmem173−/−) or in myeloid cells (tmem173Mye−/−) prevented LPS (10 mg/kg)-induced animal death (n = 9 mice/group; Log-rank test). (j) In parallel, the level of serum SQSTM1 was assayed (n = 5 mice/group; two-tailed t test, versus wild type group). Data in (b), (c), (e), (f), (g), and (j) are presented as mean ± SD. Data in (a), (d), (i), and (j) are from two independent experiments. Data in (b), (c), and (e-h) are from three independent experiments.
