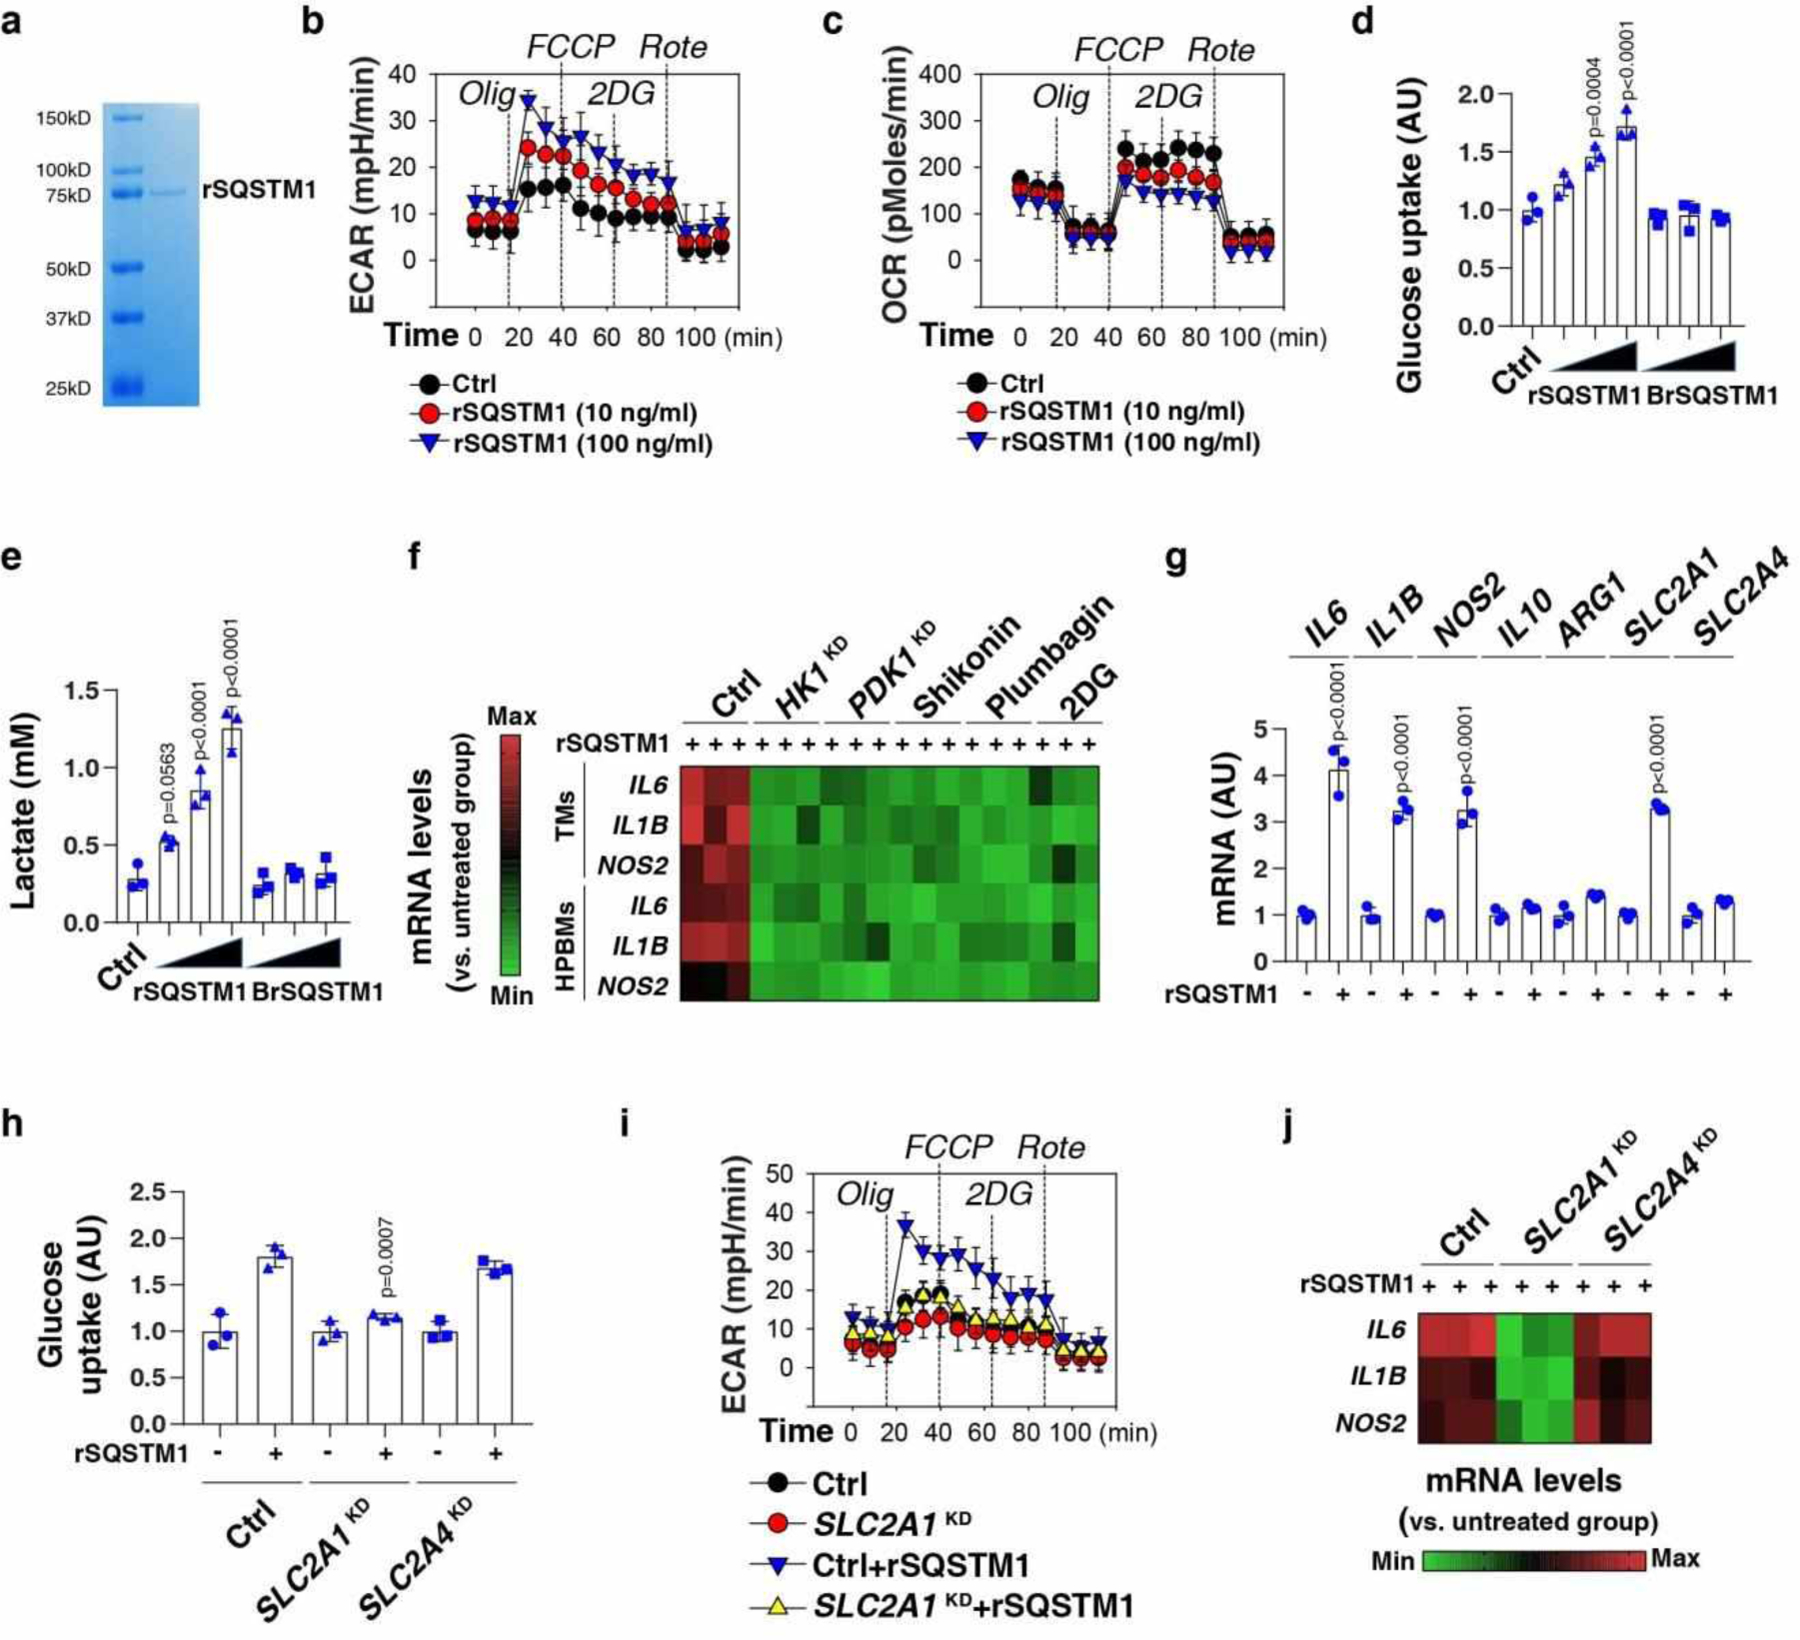
Fig. 4. Exogenous SQSTM1 promotes metabolic programming and macrophage polarization.

(a) Coomassie blue staining of the rSQSTM1 protein. (b, c) THP1-derived macrophages (TMs) were stimulated with rSQSTM1 (10 and 100 ng/ml) for 24 h and sequentially treated as indicated with oligomycin (“Olig,” 1 uM), p-trifluoromethoxy carbonyl cyanide phenyl hydrazone (“FCCP,” 0.3 uM), 2-deoxyglucose (“2DG,” 100 mM), and rotenone (“Rote,” 1 uM). Extracellular acidification rates (ECAR) indicative of glycolysis (b), and oxygen consumption rates (OCR) indicative of OXPHOS (c) were monitored using the Seahorse Bioscience Extracellular Flux Analyzer in real time. (d, e) TMs were stimulated with rSQSTM1 (10, 100, and 1000 ng/ml) or boiled rSQSTM1 (BrSQSTM1) for 24 h. The glucose uptake (d) and lactate production (e) were assayed (n = 3 well/group; one-way ANOVA test, versus control group). AU, arbitrary units. (f) Heatmap of gene mRNA changes in indicated TMs or primary HPBMs after rSQSTM1 (100 ng/ml) stimulation for 24 h with or without pharmacological (shikonin [5 μM], plumbagin [3 μM], and 2DG [2 mM]) or genetic inhibition (HK1KD or PDK1KD) of glycolysis. (g) qPCR analysis of indicated gene expression in TMs after rSQSTM1 (100 ng/ml) stimulation for 5 days (n = 3 well/group; two-tailed t test, versus untreated group). (h-j) Indicated TMs (control, SLC2A1KD or SLC2A4KD) were stimulated with rSQSTM1 (100 ng/ml) for 24 h. The glucose uptake (h), ECAR (i), and gene mRNA expression (j) were assayed (n = 3 well/group; two-tailed t test, versus control rSQSTM1 group). AU, arbitrary units. Data in (b-e) and (g-i) are presented as mean ± SD. Data in (a-c) and (i-j) are from two independent experiments. Data in (d-h) are from three independent experiments.
