
Extended Data Fig. 1. LPS induces SQSTM1 secretion in monocytes and macrophages.
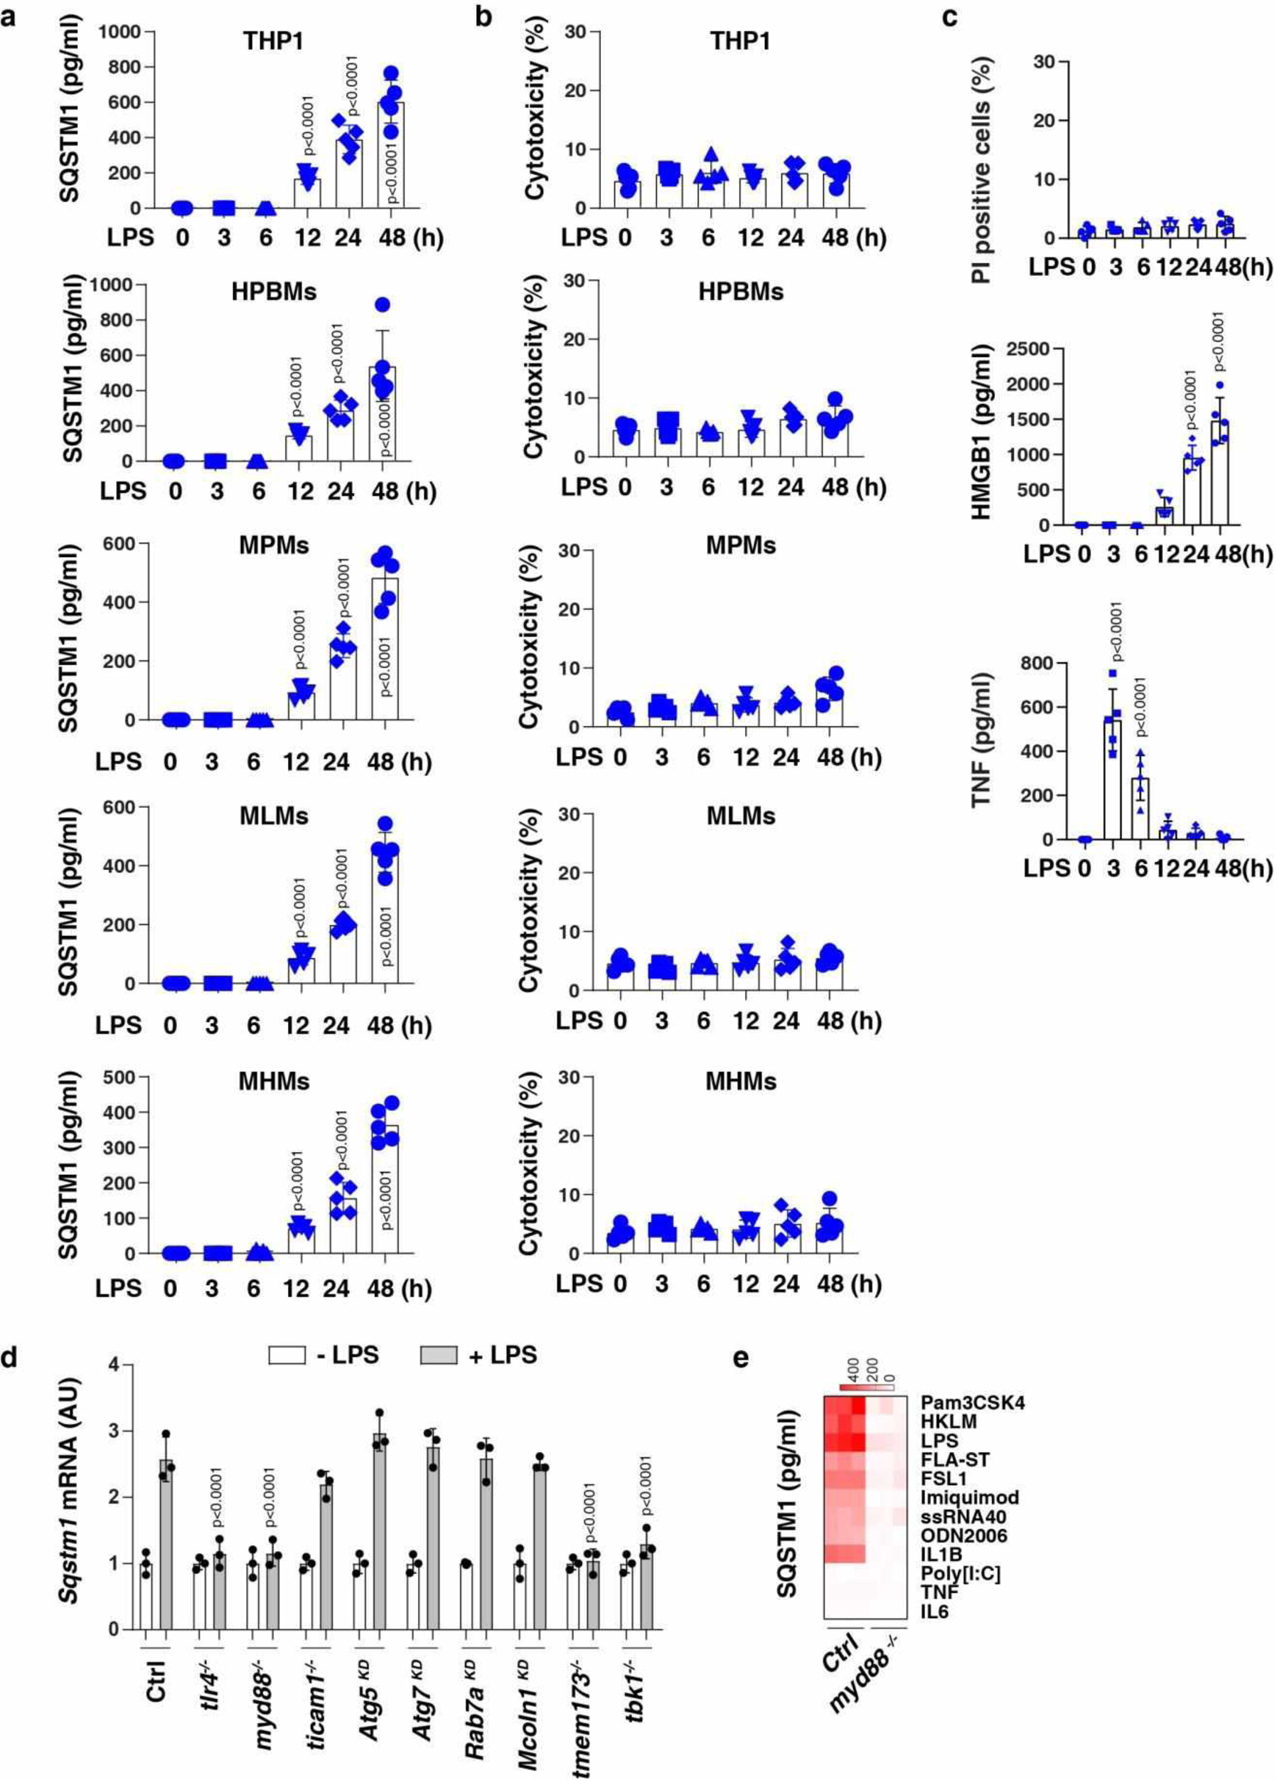
(a) ELISA analysis of SQSTM1 release in THP1 (a human monocytic cell line), primary human blood monocyte-derived macrophages (HPBMs), primary mouse peritoneal macrophages (MPMs), primary mouse lung macrophages (MLMs), and primary mouse hepatic macrophages (MHMs) following treatment with LPS (200 ng/ml) for 3–48 h (n = 5 well /group; two-tailed t test, versus untreated group). (b) LDH analysis of cytotoxicity in the indicated cells following treatment with LPS (200 ng/ml) for 3–48 h (n = 5 well /group). (c) Analysis of propidium iodide (PI)-positive cells, HMGB1 release, and TNF release in BMDMs following treatment with LPS (200 ng/ml) for 3–48 h (n = 5 well /group; one-way ANOVA test, versus control group). (d) The indicated BMDMs were treated with LPS (200 ng/ml) for 24 h and the level of Sqstm1 mRNA was assayed by qPCR (n = 3 well /group; two-tailed t test, versus control LPS group). (e) Heat map of SQSTM1 release in WT and myd88−/− BMDMs following treatment with pam3CSK4 (1 ng/ml), HKLM (107 cells/ml), poly(I:C) (10 μg/ml), LPS (200 ng/ml), FLA-ST (100 ng/ml), FSL1 (0.1 ng/ml), imiquimod (5 μg/ml), ssRNA40 (5 μg/ml), ODN2006 (10 μg/ml), IL1B (5 ng/ml), IL6 (5 ng/ml), or TNF (5 ng/ml) for 24 h. Data in (a-c) are presented as mean ± SD. Data in (a-c) and (e) are from two independent experiments. Data in (d) are from three independent experiments.