. 2020 Oct 15;2(5):e200004. doi: 10.1148/ryct.2020200004

Figure 5:

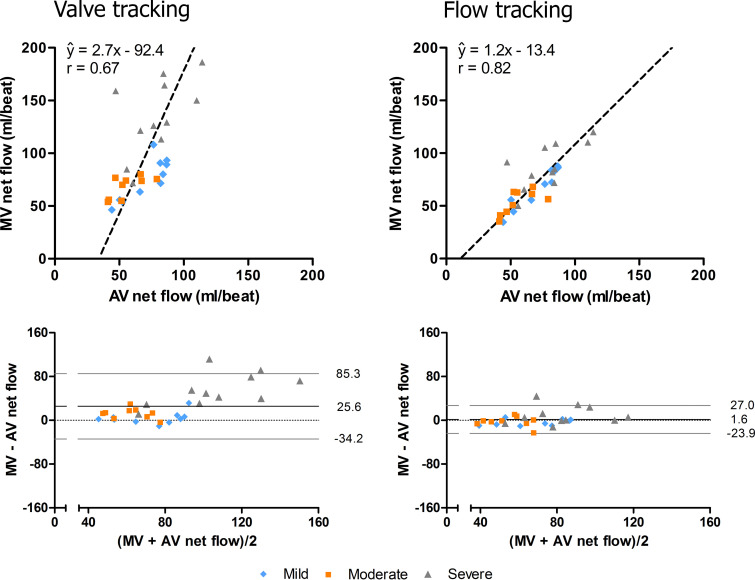
Orthogonal regression (top) and Bland-Altman (bottom) plots of mitral valve (MV) net flow measured with valve tracking (left) and flow tracking (right) versus aortic valve (AV) net flow measured with valve tracking. Mean differences and 95% limits of agreement are indicated by the black and gray lines in the Bland-Altman plots. Flow tracking demonstrates better agreement between MV net flow and AV net flow than valve tracking.

Orthogonal regression (top) and Bland-Altman (bottom) plots of mitral valve (MV) net flow measured with valve tracking (left) and flow tracking (right) versus aortic valve (AV) net flow measured with valve tracking. Mean differences and 95% limits of agreement are indicated by the black and gray lines in the Bland-Altman plots. Flow tracking demonstrates better agreement between MV net flow and AV net flow than valve tracking.