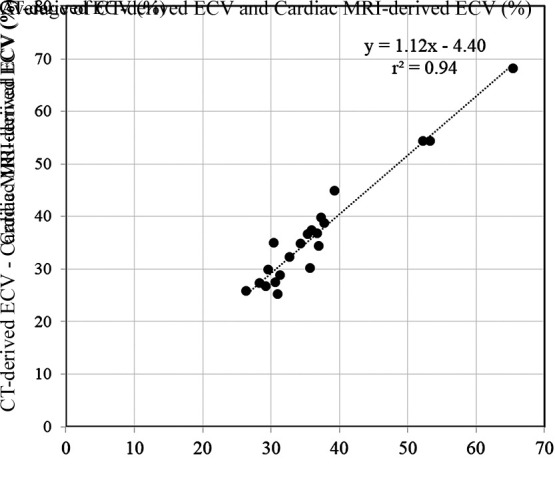
Figure 3a:

Scatterplots show results of (a) correlation and (b) Bland-Altman analyses for comparisons between CT-derived extracellular volume (ECV) and cardiac MRI–derived ECV. There was excellent correlation (r2 = 0.94; P < .01) and small bias (0.1% with 95% limits of agreement of −5.7% and 5.7%) between CT-derived ECV and cardiac MRI–derived ECV.
