. 2021 Feb 25;3(1):e200596. doi: 10.1148/ryct.2021200596

Figure 3A-.

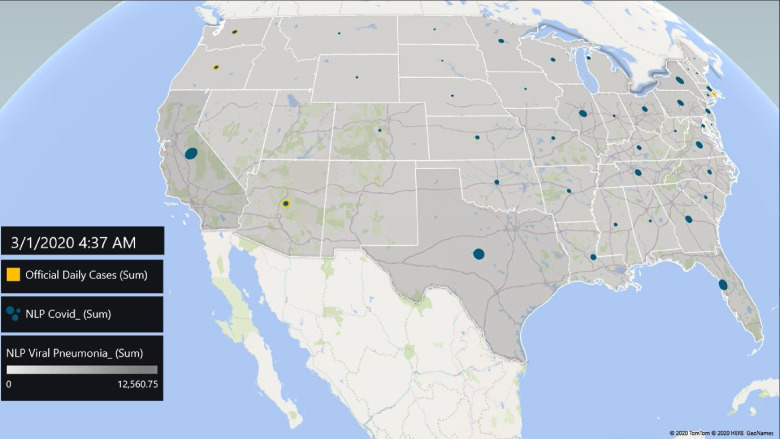
panel and Video 1. Temporal progression using a Machine-Learning based geomap comparing the rise overtime of the Viral pneumonia NLP (more general NLP) and COVID NLP (more specific NLP) with the number of official COVID-19 cases (Period January 1st, 2020 to October 3rd, 2020).March 1st snapshot: note below the progression of the Viral pneumonia NLP cases (gray areas in the states) which correlates with the flu season and the appearance of the COVID NLP cases (blue circles), as well as slightly increase in the number of official COVID-19 cases (yellow circles).

panel and Video 1. Temporal progression using a Machine-Learning based geomap comparing the rise overtime of the Viral pneumonia NLP (more general NLP) and COVID NLP (more specific NLP) with the number of official COVID-19 cases (Period January 1st, 2020 to October 3rd, 2020). March 1st snapshot: note below the progression of the Viral pneumonia NLP cases (gray areas in the states) which correlates with the flu season and the appearance of the COVID NLP cases (blue circles), as well as slightly increase in the number of official COVID-19 cases (yellow circles).