. 2021 Feb 25;3(1):e200596. doi: 10.1148/ryct.2021200596

Figure 3C-.

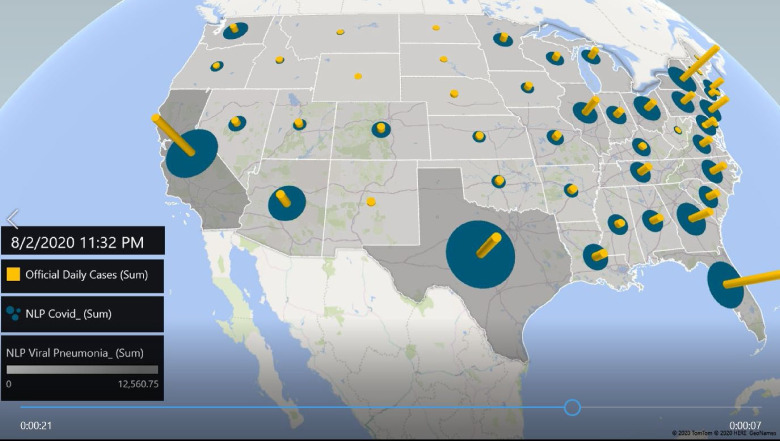
August 2nd snapshot: note below the continuous increase of the COVID NLP cases particularly in Florida, California and Texas (blue circles enlarging) and a continuous material increase in the number of official COVID-19 cases (yellow circles growing vertically). Please note the correlation between the size of the blue circles and the height of the yellow vertical bars in each state.

August 2nd snapshot: note below the continuous increase of the COVID NLP cases particularly in Florida, California and Texas (blue circles enlarging) and a continuous material increase in the number of official COVID-19 cases (yellow circles growing vertically). Please note the correlation between the size of the blue circles and the height of the yellow vertical bars in each state.