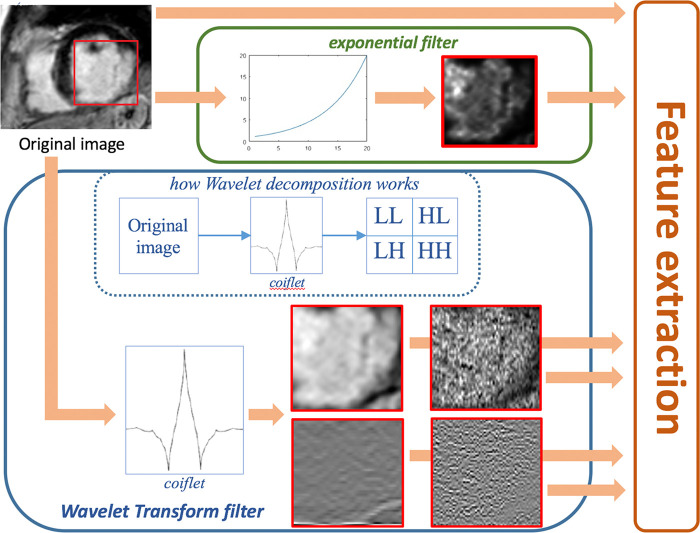
Figure 4:
Graphical representation of the two-dimensional filtering process (preferred to three-dimensional filtering for simplicity of visualization). Features were computed from original images, from four wavelet-filtered sub-band images and from exponential-filtered images. In the red boxes within each filter, the results of the filters applied to the red box in the original image are shown. The dotted blue box summarizes how wavelet filtering decomposes the original image.

