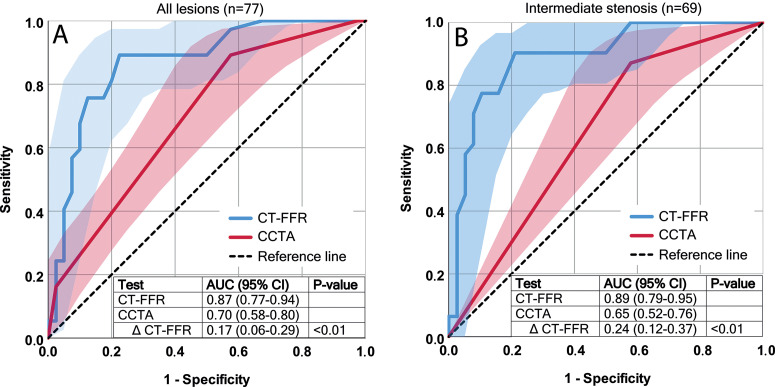
Figure 3:
Receiver operating characteristic (ROC) curves for CT angiography–derived fractional flow reserve (CT FFR) (blue line) and degree of stenosis at coronary CT angiography (CCTA) (red line) with 95% confidence interval bands (blue and red areas) and corresponding area under the ROC curve (AUC) values in, A, all lesions and in, B, intermediate lesions only.

