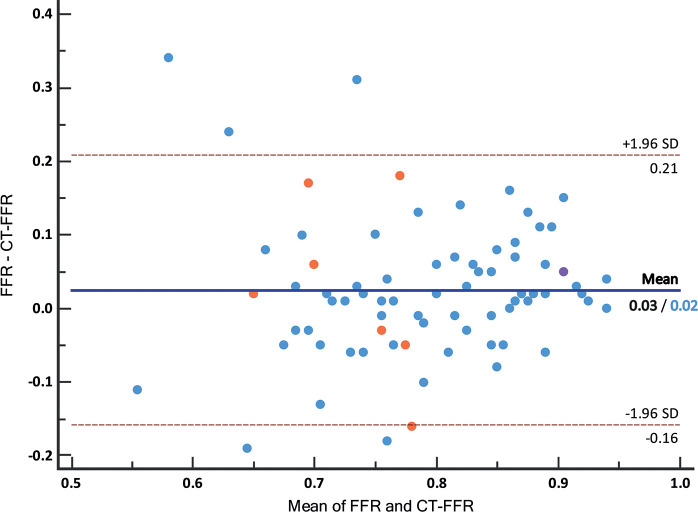
Figure 5:
Bland-Altman plot of CT angiography–derived fractional flow reserve (CT FFR) and invasive FFR values. Color of the dots indicates degree of stenosis at coronary CT angiography, with low-grade stenosis (<25%, one vessel) in purple, intermediate-degree stenosis (25%–69%, 69 vessels) in blue, and high-grade stenosis (≥70%, seven vessels) in orange. Mean difference was 0.03 for all lesions and 0.02 for intermediate stenosis only, ±1.96 standard deviation (SD) was similar for both groups with an interval of −0.16 to 0.21.

