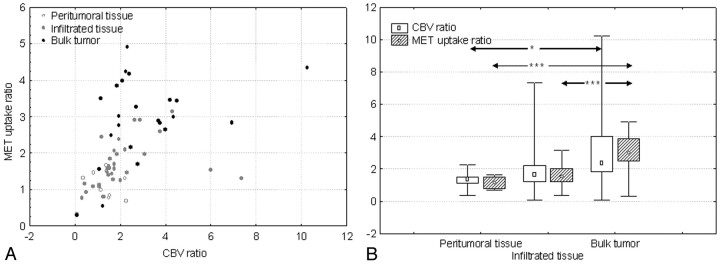
Fig 2.
A, Scatterplot shows significant positive correlation between CBV ratios and MET uptake ratios (r = 0.65, P < .001). Measurements corresponding to “peritumoral tissue,” “infiltrated tissue,” and “bulk tumor” can also be identified.
B, Graph shows the relation between both CBV and MET uptake ratios and the histologic categorization of samples as “peritumoral tissue” (n = 10), “infiltrated tissue” (n = 32), and “bulk tumor” (n = 23). Median values increase significantly from “peritumoral tissue” to “bulk tumor” for both CBV and MET uptake ratios. The difference was also statistically significant between “infiltrated tissue” and “bulk tumor” for MET uptake ratios. Values are presented as minimum-maximum range (whiskers), 25th–75th percentile range (box), and median (open symbols). ∗, P = .01; ∗∗∗, P < .001.

