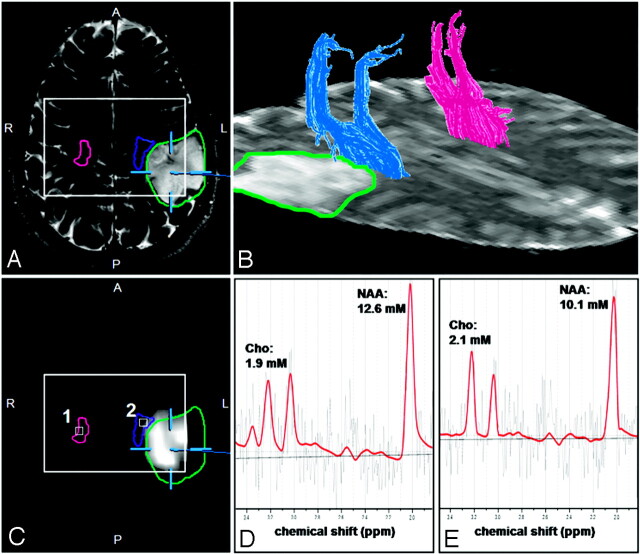
Fig 2.
Results of the fiber-tracking procedure of the DTI data and the spectral analysis of the MRSI data for a patient with a hypesthesia in right arm (patient 14 in Table 1). Screenshot from the planning workstation of a navigation system of an axial T2-weighted MR imaging (A) coregistred with a segmented metabolic Cho/NAA map (C). Overlaid on these images are the cross sections of the ipsilateral (blue) and contralateral (magenta) pyramidal tracts, the tumor segmented manually by a neurosurgeon (green), and the PRESS-box of the MRSI experiment (white rectangle).
B, a 3D reconstruction of the ipsilateral (blue) and contralateral (magenta) pyramidal tracts depicted on the axial sections of the DTI dataset measured with a b-value = 0 s/mm2. LCModel fits (red line) of the MRSI data of voxel positions 1 (D) and 2 (E) as depicted in C as white squares. Overlaid on these images are the molar concentrations for Cho, Cr, and NAA calculated by LCModel.

