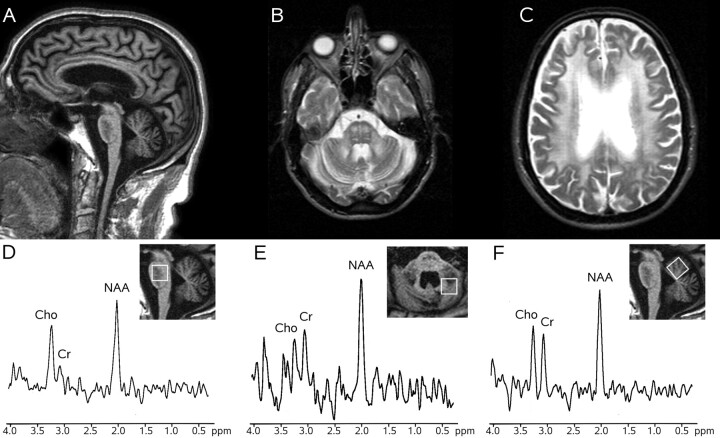
Fig 2.
MR imaging and 1H-MR spectroscopy in a patient with FXTAS (case 2). Sagittal T1-weighted gradient recalled-echo image (TR = 25 ms, TE = 4.6 ms, flip angle = 30°, 1 NEX) (A) shows diffuse brain atrophy with sparing of the oval shape of the basis pontis, which exhibits a diffuse low signal intensity. Axial T2-weighted spin-echo images (TR = 2400 ms, TE = 200 ms, 1 NEX) (B and C) show symmetric hyperintensity in the pons and middle cerebellar peduncles and diffuse hyperintensity in the cerebral periventricular white matter (C). 1H-MR spectroscopy of the pons (D), right dentate and peridentate white matter (E), and superior vermis (F) shows normal metabolite ratios.

