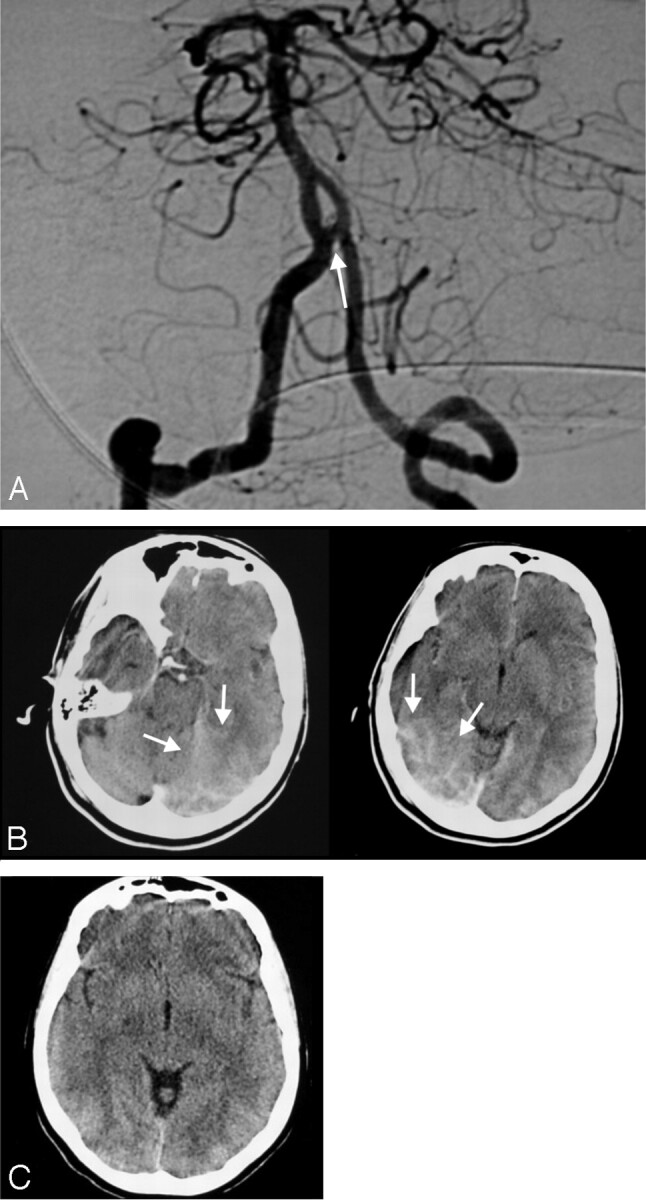
Fig 3.

Posttreatment angiogram (A) shows the completely occluded small aneurysm (arrows) at the vertebrobasilar junction of the fenestrated basilar artery (patient 20). Posttreatment CT image (B) reveals increased attenuation in the posterior cerebral artery territory bilaterally (arrow). Control CT scan (C) obtained 5 hours after the first one shows complete resolution of the finding.
