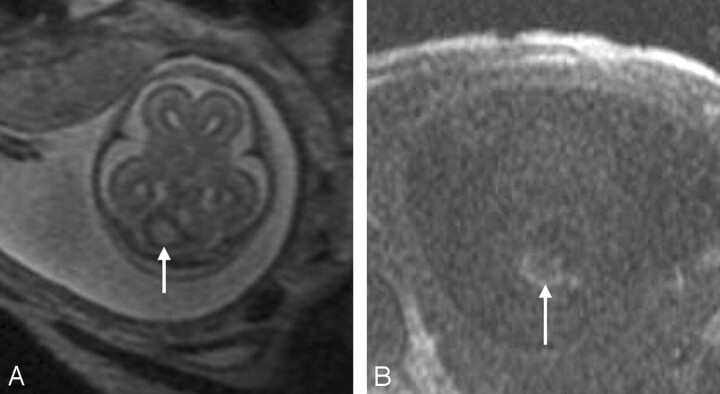
Fig 8.
A, Axial SS-FSE T2-weighted image demonstrates an area of increased signal intensity with peripheral decreased signal intensity in the right cerebellar hemisphere (arrow).
B, Axial FMP-SPGR T1-weighted image at corresponding level shows areas of increased signal intensity consistent with cerebellar hemorrhage (arrow). Bilobed appearance of the hematoma on both T1- and T2-weighted images suggests possible involvement of the cerebellar vermis.

