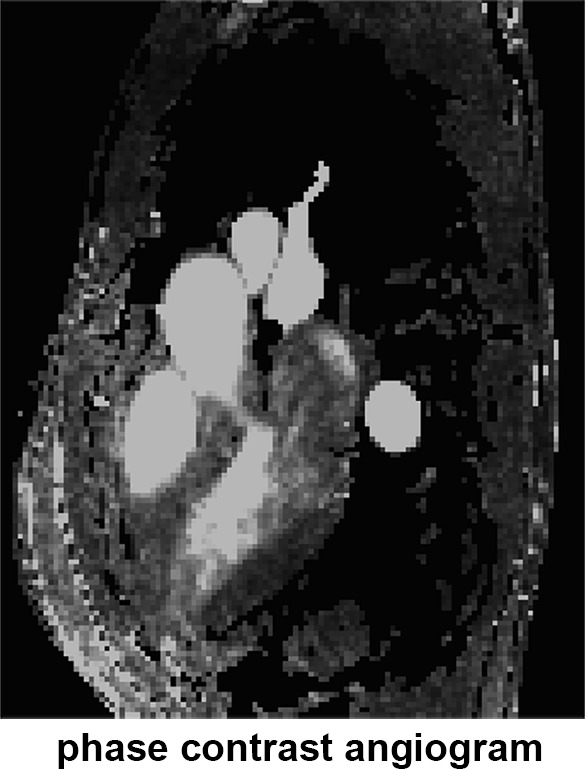
Figure 1b:

(a) Four-dimensional (4D) flow MR images acquired in a patient with hypertrophic cardiomyopathy, (b) a slice of the phase-contrast angiogram with (c) one slice of the segmentation, and (d) the three-dimensional (3D) segmentation. (e) The ventricular and atrial systolic time frames are defined by the maximum averaged velocity in the segmentation with the accompanying velocity vectors shown in (f).
