
Figure 2d:
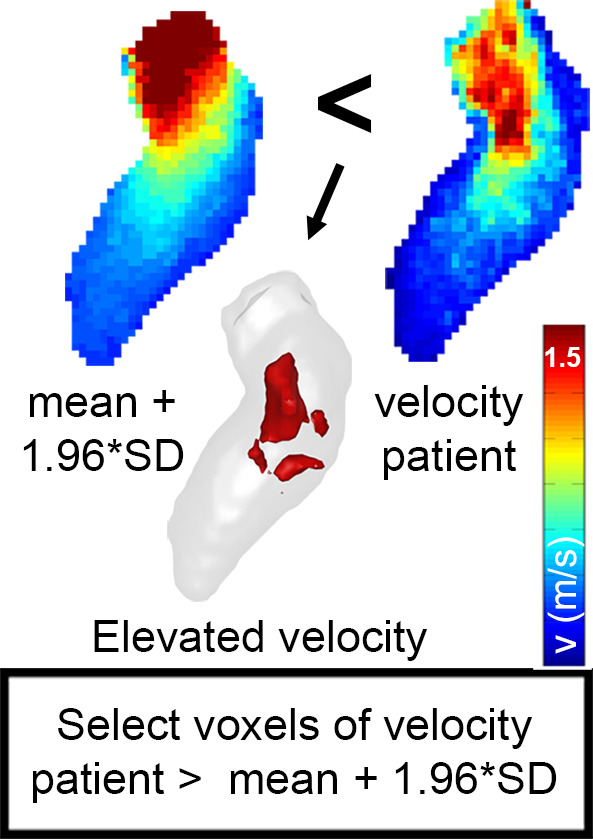
(a) Segmented velocity vectors of a data set of patients with hypertrophic cardiomyopathy mapped on a cine image at the ejection phase. (b) The left ventricular segmentation of the patient was coregistered to the control “shared” geometry and the difference in overlap, quantified. (c) The control-averaged velocity values were interpolated to the patient geometry and the differences in velocity, quantified. The standard deviation (SD) map of the control cohort was interpolated to the patient geometry as well to create a map of the upper limit of the 95% confidence interval shown in (d). By three-dimensional rendering of the voxels where the velocity values of the patient were higher than the mean + 1.96 SD map, elevated velocity was visualized. * indicates multiplication. Ao = aorta, LA = left atrium, MV = mitral valve.