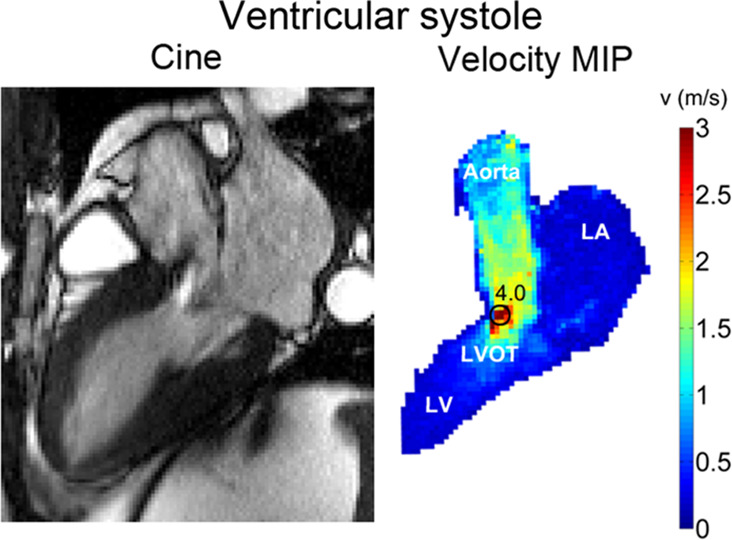
Figure 3a:

(a) Cine steady-state free precession (SSFP) image in a patient with hypertrophic cardiomyopathy with a bright signal in the left ventricular outflow tract (LVOT) indicating jet flow caused by LVOT obstruction during the ventricular systolic phase. Quantification of peak velocity based on the 4D flow–derived velocity maximum intensity projection (MIP) revealed a peak velocity of 4.0 msec in the LVOT. (b) Cine SSFP image during the atrial systolic phase. Quantification of peak velocity resulted in 0.8 msec in the LVOT. LA = left atrium, LV = left ventricle.
