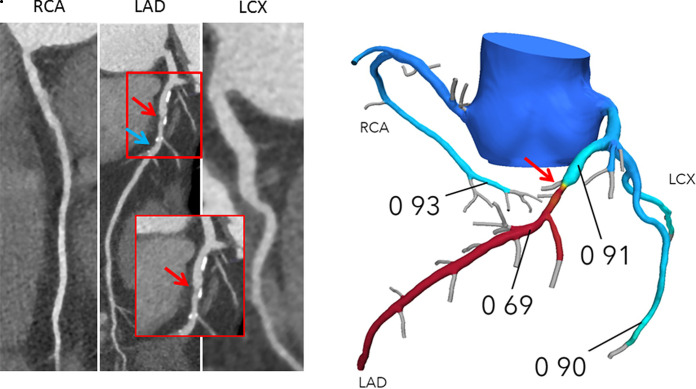
Figure 1b:
(a) Interpretation of FFRCT results in a 65-year-old woman with typical angina. Agatston score, 333. Left: Coronary CT angiography curved multiplanar reconstructions demonstrate a 50%–69% proximal left anterior descending artery (LAD) stenosis (red arrow) and in the mid-LAD, nonobstructive diffuse disease. The blue arrow indicates where the lesion-specific FFRCT value was assessed. Right: In the FFRCT three-dimensional model, the FFRCT value 16 mm distal to the stenosis was 0.85, indicating that the lesion did not cause significant pressure loss. However, FFRCT was significantly low (0.76) in the terminal vessel segments. (b) Interpretation of FFRCT results in a 63-year-old man with atypical angina. Agatston score, 245. Left: Coronary CT angiographic images demonstrate a 50%–69% proximal LAD stenosis (red arrow). The blue arrow indicates where the lesion-specific FFRCT value was assessed. Right: In the FFRCT three-dimensional model, the FFRCT value 14 mm distal to the stenosis indicated that the lesion was hemodynamically significant with a value of 0.69. Coronary CT angiography and FFRCT reporting are demonstrated in Figure 4. LCX = left circumflex coronary artery, RCA = right coronary artery.

