. 2020 Aug 27;2(4):e190188. doi: 10.1148/ryct.2020190188

Figure 2:

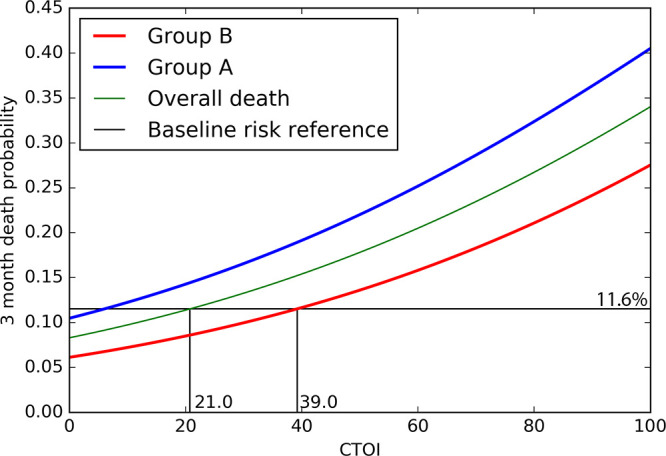
Estimated probability of 3-month mortality as a function of the CT obstruction index (CTOI), obtained from the logistic regression model for the overall population (green), group A (blue), and group B (red). The horizontal black line (baseline risk reference, 11.6%) represents the ratio of patients who died within 3 months in the overall population, indicating the overall probability of dying following the diagnosis of acute pulmonary embolism without taking into account any other variable. Group A includes patients with prior cardiopulmonary disease (CPD); group B includes patients without CPD.

Estimated probability of 3-month mortality as a function of the CT obstruction index (CTOI), obtained from the logistic regression model for the overall population (green), group A (blue), and group B (red). The horizontal black line (baseline risk reference, 11.6%) represents the ratio of patients who died within 3 months in the overall population, indicating the overall probability of dying following the diagnosis of acute pulmonary embolism without taking into account any other variable. Group A includes patients with prior cardiopulmonary disease (CPD); group B includes patients without CPD.