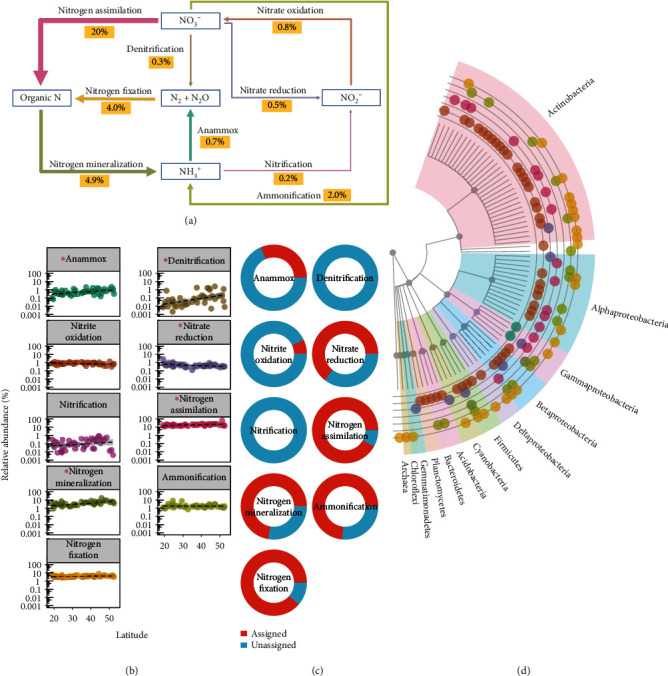
Figure 3.

Nitrogen biogeochemical cycle genes in forest soils. (a) Nitrogen biogeochemical cycle; arrow width indicates proportion of biomarker gene contigs for corresponding pathways. (b) Linear relationships between contigs and latitude. Asterisks indicate significant correlation with latitude (P < 0.05, n = 45). (c) Proportion of contigs assigned to known taxa. (d) Distribution of known taxa.
