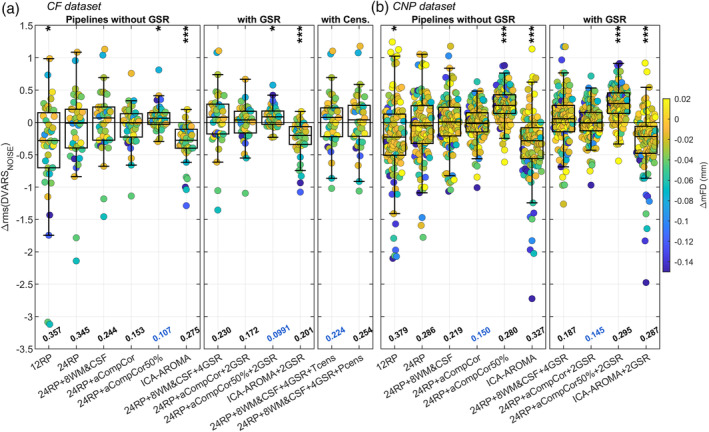
FIGURE 2.

Task‐associated changes in DVARSNOISE. The box plots show the distribution of the difference in rms(DVARSNOISE) between task and rest—i.e., Δrms(DVARSNOISE) = rms(DVARSNOISE|TASK) − rms(DVARSNOISE|REST)—for all considered pipelines, separately for CF (a) and CNP (b) datasets. Δrms(DVARSNOISE) values, calculated separately for each run (40 and 120 runs for the CF and CNP dataset, respectively), are color‐coded based on the task‐associated difference in mFD. At the bottom of each box is reported the median of the absolute Δrms(DVARSNOISE), with the smallest value highlighted in blue. On top of each box the asterisks mark whether the mean of the distribution is significantly different from zero as indicated by a one‐sample t‐test (performed after averaging runs from the same subjects); ***p <.001, **p <.01, *p <.05
