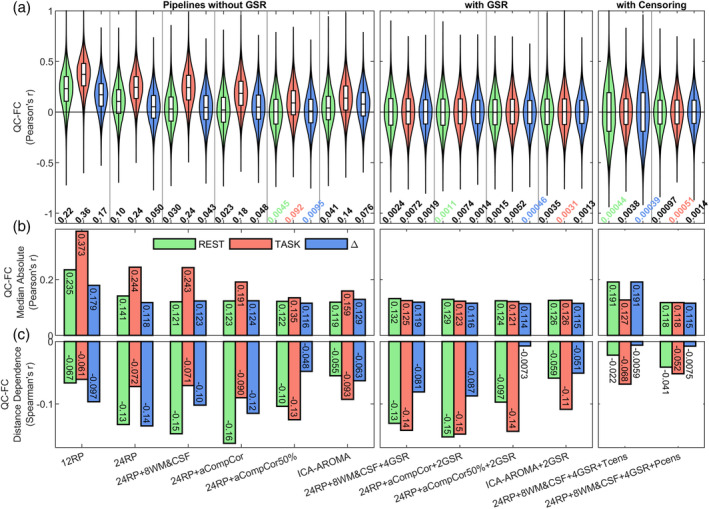
FIGURE 4.

QC‐FC plots for evaluating the across‐subject relationship between motion (mFD) and connectivity estimates under different denoising strategies for the CF dataset. The top panels (a) show the distribution of QC‐FC correlations along with the absolute mean value of the correlations, aiming at quantifying the centering of the distributions. The middle panels (b) show the median value of the absolute QC‐FC correlations, which takes into account both the centering and the spread of the distribution. The bottom panels (c) show the Spearman's correlation between QC‐FC correlations and the Euclidean distance between pairs of nodes, indexing distance‐dependent artifacts. QC‐FC results are displayed for REST and TASK separately. For the task‐based change in FC (ΔFC = FCtask − FCrest), the residual relationship with motion was evaluated with respect to the change in mFD (mFD = mFDtask − mFDrest)
