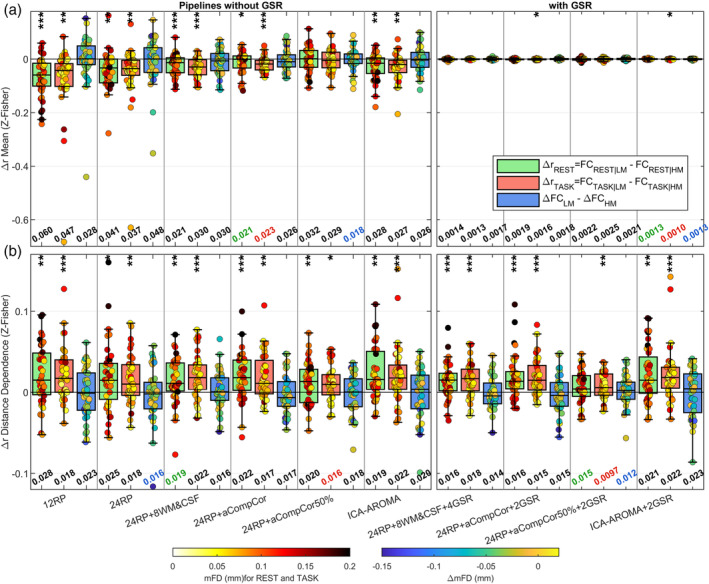
FIGURE 5.

Censoring analysis (Δr) to evaluate residual artifacts in the CF dataset associated with the most moving volumes of each subject. For each run, Δr values were obtained by subtracting FC estimated using the least motion‐affected volumes (FC|LM) from FC estimated using the most motion‐contaminated volumes (FC|HM), where in both cases the top/bottom 20% of volumes were discarded. From the run‐specific Δr values, two quantities were extracted: (a) the mean, which indexes residual global artifacts, and (b) the distance‐dependent effect of motion of FC estimates, obtained by calculating the Spearman's correlation between Δr and the Euclidean distance between pairs. This analysis was run separately for rest (Δr REST) and task (Δr TASK), while the effect on task‐related change in FC was estimated by computing ΔFCLM − ΔFCHM, where ΔFC = FCTASK − FCREST. The box plots contain the distribution of the means (a) and distance‐dependent effects (b) across 40 points (20 subjects × 2 runs). Each data point is color‐coded based on mFD, for rest and task conditions, or based on ΔmFD, for the ΔFC comparison. At the bottom of each panel is reported the median absolute of the distribution, which takes into account both the centering and the spread of the distribution; the smallest median absolute values are color‐coded based on the functional condition. On top of each panel the asterisks mark whether the mean of the distributions are significantly different from zero as indicated by one‐sample t‐tests (performed after averaging the two runs); ***p <.001, **p <.01, *p <.05
