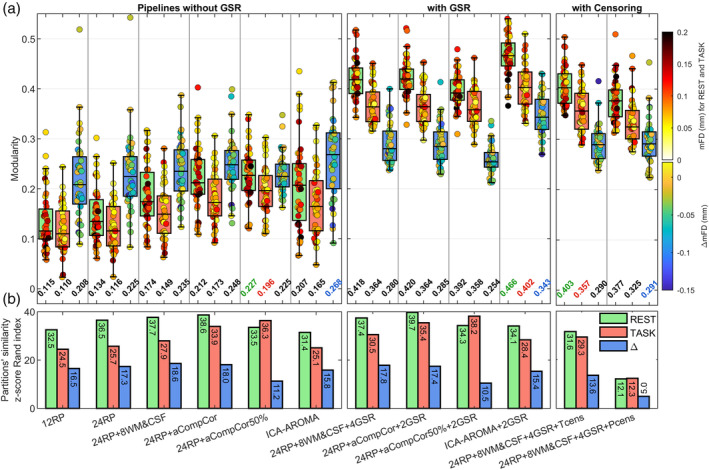
FIGURE 6.

Results of the network modularity analysis for the CF dataset. (a) The box plots show the across‐subject distribution of modularity for each functional condition (REST and TASK) and for the differential condition (Δ = TASK − REST). The 40 runs (20 subjects × 2 runs) composing the box plots are color‐coded based on mFD, for rest and task conditions, or based on ΔmFD, for the Δ comparison. At the bottom of each box plot is reported the median of the distribution, with the largest values that are color‐coded based on the functional condition. (b) Partitions' similarity across subject, assessed via z‐score of Rand index
