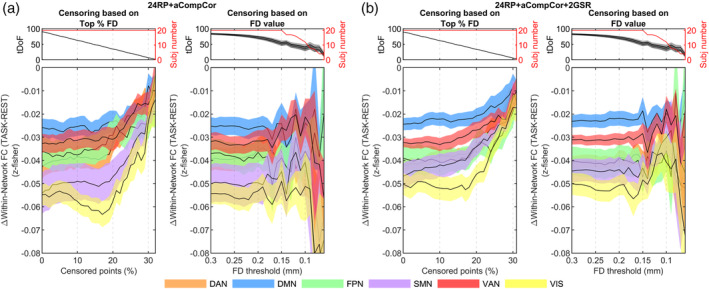
FIGURE 8.

Incremental censoring analysis for within‐network FC considering models (a) RP24 + aCompCor and (b) RP24 + aCompCor + 2GSR. In each panel, the left plot shows a P‐censoring analysis while the right plot a T‐censoring analysis. In P‐censoring an equal number of volumes were excised from rest and task conditions ensuring condition comparability in terms of tDoF, yet at the expense of removing potentially good volumes in the task condition. In T‐censoring a more efficient data cleaning comes at the expense of variable tDoF among conditions and, in case of severe thresholds, at the progressive elimination of subjects with the highest motion. For each network, the mean across subjects of FC is shown as a black line along with shades representing the standard error of the mean (SEM), color‐coded based on the network. Likewise, tDoF for the T‐censoring variant are represented with the mean and SEM (light‐gray shade for task, darker for rest). DAN, dorsal attention; DMN, default mode, FPN, frontoparietal; SMN, somatomotor; VAN, ventral attention; and VIS, visual network
