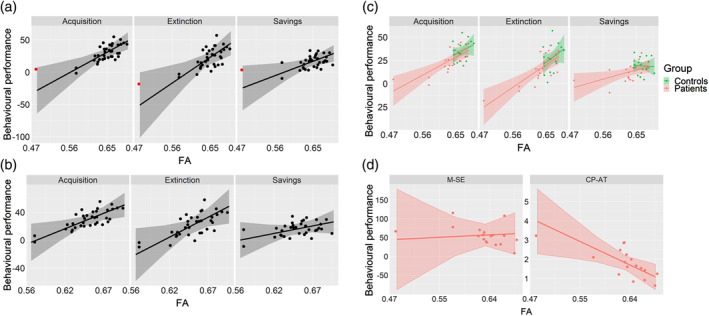
FIGURE 4.

(a–c) Correlations between FA and behavioural performance within the superior peduncle for the eyeblink conditioning task. (a) Identification of an apparent “outlier” (red dot). (b) Removal of the “outlier” did not substantially change the resulting slopes and associated standard errors. (c) Same plot as (a) but colour‐coded to distinguish between cerebellar and control participants' performance. (d) Correlation between FA and behavioural performance for the metronome (M‐SE) and cart‐pole balancing tasks (CP‐AT)
