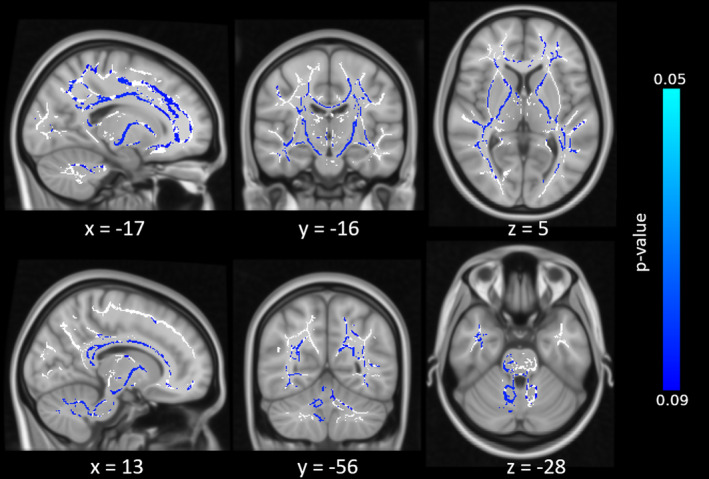
FIGURE 7.

Tract‐based spatial statistics (TBSS) results for the cerebellar participant group only, testing which voxels show a correlation with the M‐SE. Blue colour indicate voxels that were short of significance (p < .09) after correcting for multiple comparisons, white shows the white matter skeleton (threshold 0.3–0.7)
