
FIGURE 2.
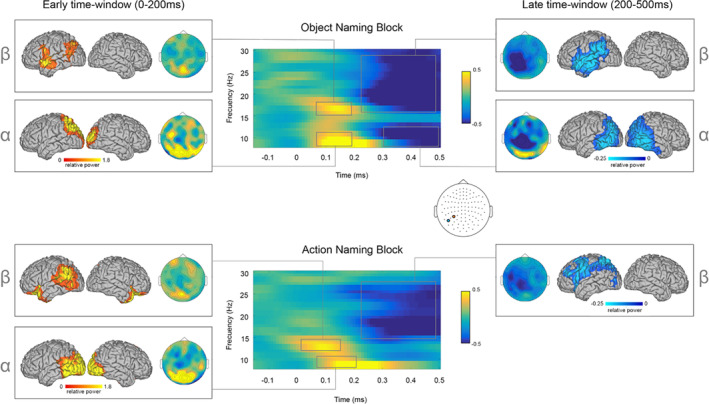
Oscillatory signatures of speech production in healthy controls. TFR of alpha and beta power in the object (top panel) and action (bottom panel) conditions over time. TFRs are plotted as relative power change compared to the baseline period over representative significant sensors (objects = M1632 + M1633; highlighted in orange; actions = M1722 + M1723; highlighted in blue). Topographic distribution plots show posterior alpha and beta power increases at early stages (0–200 ms), and left‐lateralized anterior and posterior beta power decreases at later stages (200–500 ms)