
FIGURE 4.
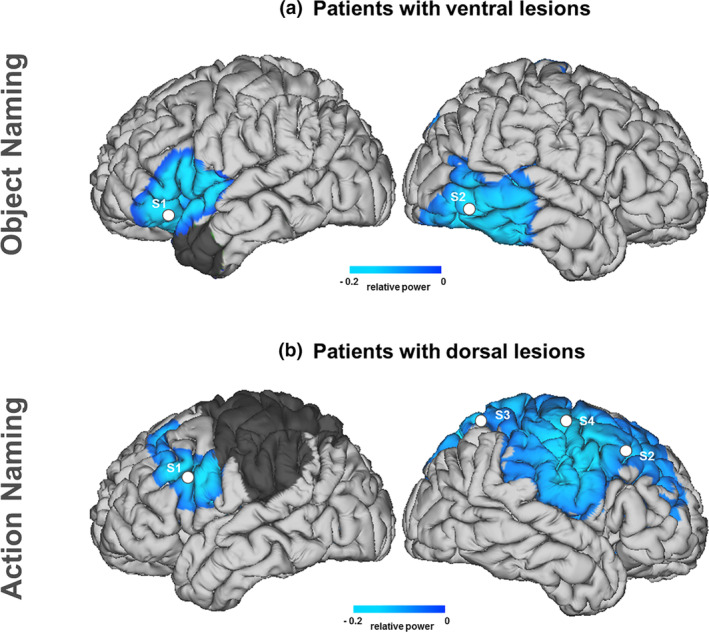
Source reconstruction of oscillatory longitudinal effects (post vs. pre). Regions showing beta power changes for patients with ventral (a) and dorsal (b) lesions. Significant peak activity locations (MNI coordinates [x, y, z]) within these areas are marked with white dots. Post‐surgery lesion mask overlap is displayed in gray. For the object naming condition: S1 = left IFG [BA45: −52, 19, 4] and S2 = right posterior middle‐temporal gyrus [BA21: 64, −36, −1]. For the action naming condition: S1 = left IFG [BA44: −50, 16, 27], S2 = right medial‐frontal gyrus [BA9: 34, 39, 34], S3 = right superior parietal cortex [BA7: 19, −67, 62], and S4 = right dorsal premotor cortex [BA6: 43, −7, 50]