
FIGURE 1.
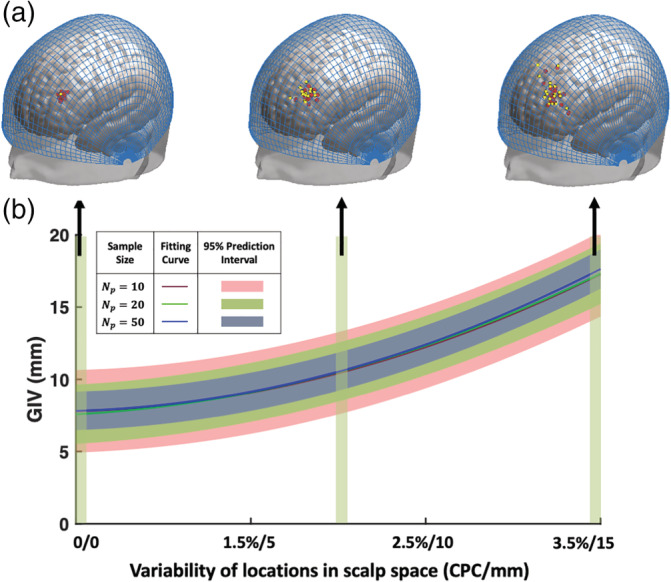
Relationship between location variability in scalp space and brain space. (a) Representative scalp locations (yellow dots) and their corresponding brain projections (red dots) of Np = 20 participants, which are displayed on the MNI152 head template with overlayed continuous proportional coordinates (CPCs) (blue grid). (b) Correlation between variability in scalp space and brain space. Different colored curves represent different numbers of participants (Np) used in evaluating the relationship