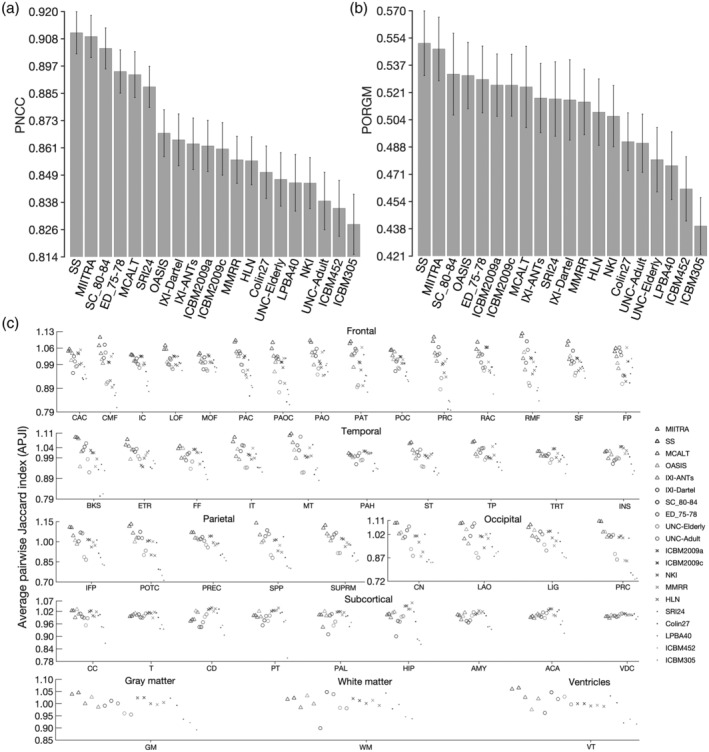
FIGURE 7.

(a) Average pairwise normalized cross‐correlation (PNCC), (b) average pairwise overlap of Free‐Surfer generated regional gray matter labels (PORGM), and (c) average pairwise Jaccard index (PJI) for individual gray matter labels, as well as for whole gray matter, white matter and ventricles, over all spatially normalized Alzheimer's Disease Neuroimaging Initiative (ADNI) participants when using Multichannel Illinois Institute of Technology & Rush university Aging (MIITRA), other standardized and study‐specific (SS) templates as reference. The error‐bars denote the SD of PNCC and PORGM. Caudal anterior cingulate (CAC), caudal middle frontal (CMF), isthmus cingulate (IC), lateral orbitofrontal (LOF), medial orbitofrontal (MOF), paracentral (PAC), pars opercularis (PAOC), pars orbitalis (PAO), pars triangularis (PAT), posterior cingulate (POC), precentral (PRC), rostral anterior cingulate (RAC), rostral middle frontal (RMF), superior frontal (SF), frontal pole (FP), banks of the superior temporal sulcus (BKS), entorhinal (ETR), fusiform (FF), inferior temporal (IT), middle temporal (MT), parahippocampal (PAH), superior temporal (ST), temporal pole (TP), transverse temporal (TRT), insula (INS), inferior parietal (IFP), postcentral (POTC), precuneus (PREC), superior parietal (SPP), supramarginal (SUPRM), cuneus (CN), lateral occipital (LAO), lingual (LIG), pericalcarine (PRC), cerebellum cortex (CC), thalamus (T), caudate (CD), putamen (PT), pallidum (PAL), hippocampus (HIP), amygdala (AMY), accumbens area (ACA), ventral diencephalon (VDC)
