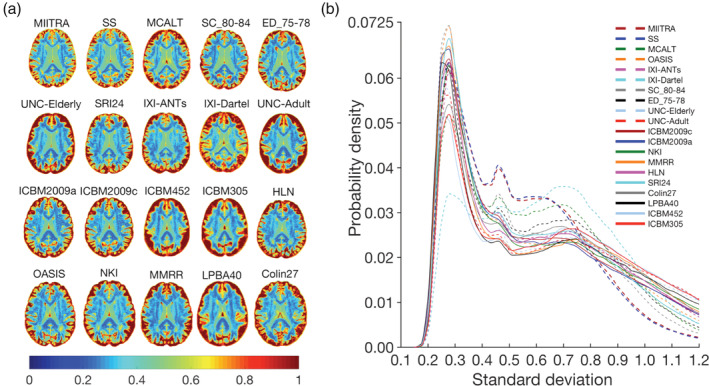
FIGURE 8.

(a) Maps and (b) histograms of the SD of image intensities of spatially normalized Alzheimer's Disease Neuroimaging Initiative (ADNI) data when using Multichannel Illinois Institute of Technology & Rush university Aging (MIITRA), other standardized and study‐specific (SS) templates as reference
