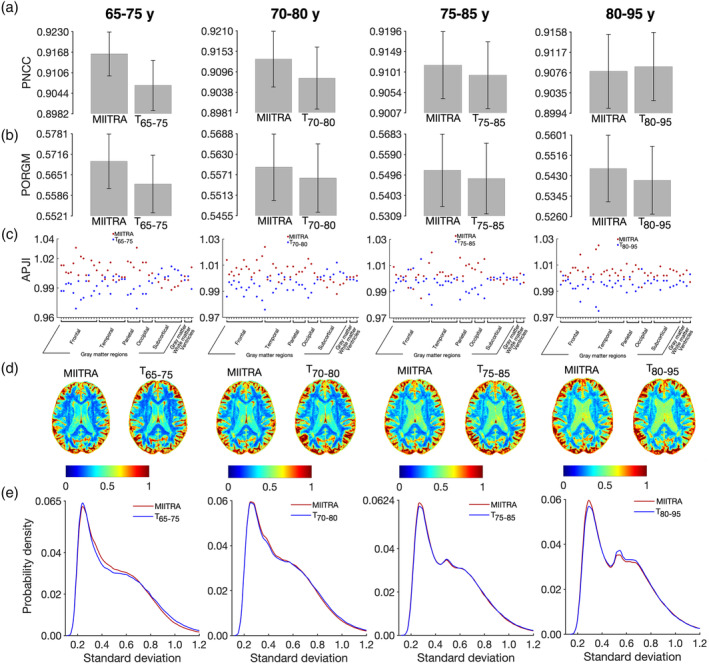
FIGURE 9.

(a) Average pairwise normalized cross‐correlation (PNCC), (b) average pairwise overlap of FreeSurfer‐generated regional gray matter labels (PORGM), (c) average pairwise Jaccard index (PJI) for individual gray matter labels, as well as for whole gray matter, white matter, and ventricles, (d) maps and (e) histograms of the SD of image intensities of spatially normalized Alzheimer's Disease Neuroimaging Initiative (ADNI) data from narrow age‐range subsets of Dataset 2 (Dataset 265–75, Dataset 270–80, Dataset 275–85, Dataset 280–95), when using Multichannel Illinois Institute of Technology & Rush university Aging (MIITRA) or the corresponding narrow age‐range templates (T65–75, T70–80, T75–85, T80–95) as reference. The error‐bars denote the SD of PNCC and PORGM
