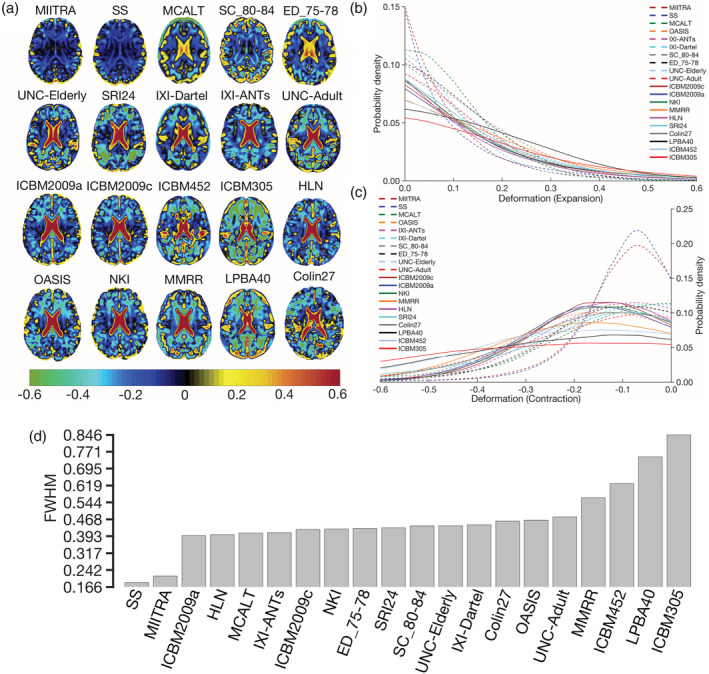
FIGURE 11.

(a) Maps of the average of the log‐Jacobian determinant of the deformation of spatially normalized Alzheimer's Disease Neuroimaging Initiative (ADNI) data when using Multichannel Illinois Institute of Technology & Rush university Aging (MIITRA), other standardized and study‐specific (SS) templates as reference. (b) Histograms depicting the average deformation of spatially normalized ADNI data in terms of expansion and (c) contraction for registration to the different templates. (d) Full‐width‐at‐half‐max (FWHM) of the histograms obtained by combining (b, c)
