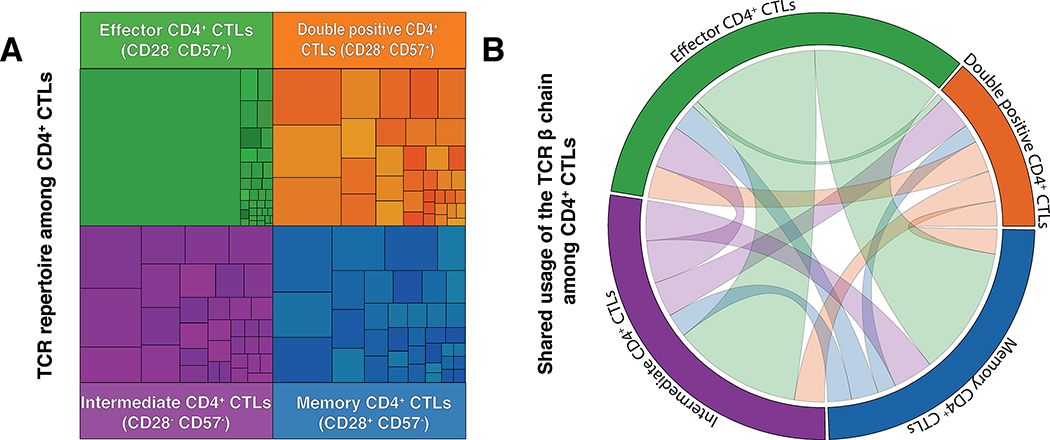
Figure 2. CD28- CD57+ CD4+ CTLs are clonally restricted in fibrosing mediastinitis.
(A) Analysis of the diversity of the TCR β usage among the 4 subsets of CD4+CTLs. The surface of each square in treemap graph represent the relative frequency of the use of a single TCR β chain in the population. (B) Shared usage of the TCR β chain between the different populations of CD4+CTLs. In order to assess the phylogeny of the different T cells subsets, we looked at the frequency of shared clones expressed in each CD4+ CTLs subset (Effector[Green], Intermediate[Purple], Unspecified[Orange] and Memory[Blue]) using a circos plot. The shared TCR β clonotype are illustrated by a ribbon linking the 2 subsets in which the clone was detected. The thickness of the ribbon represents the frequency of the shared clonotype between the various subsets of CD4 CTLs.
(n = 5; representative patient shown).

