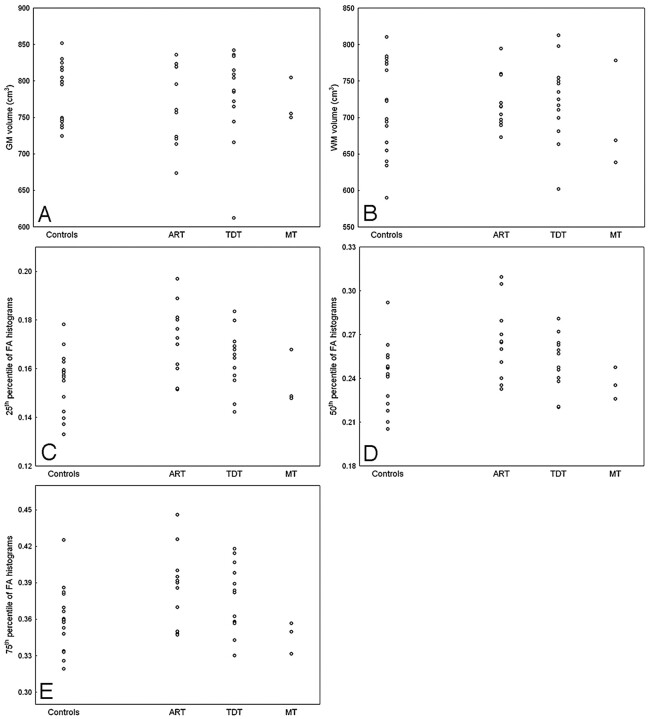
Fig 1.
Scatterplots showing the distribution of the GM (A) and WM (B) volumes and of the twenty-fifth (C), fiftieth (D), and seventy-fifth (E) percentiles of the whole-brain FA histogram in the healthy controls and in the subgroups of patients with PD including those with tremor-dominant type (TDT), akinetic-rigid type (ART), and mixed type (MT).

