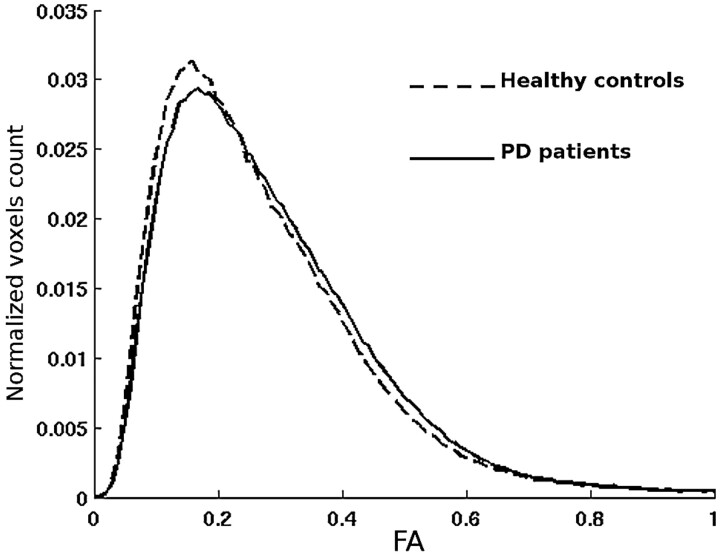
Fig 2.
Averaged whole-brain FA histograms in healthy controls (dashed line) and the whole group of patients with PD (continuous line). Note the right shift of the FA histogram curve in patients with PD, implying higher anisotropy values, and its lower asymmetry (skewness) with respect to the curve of the controls.

