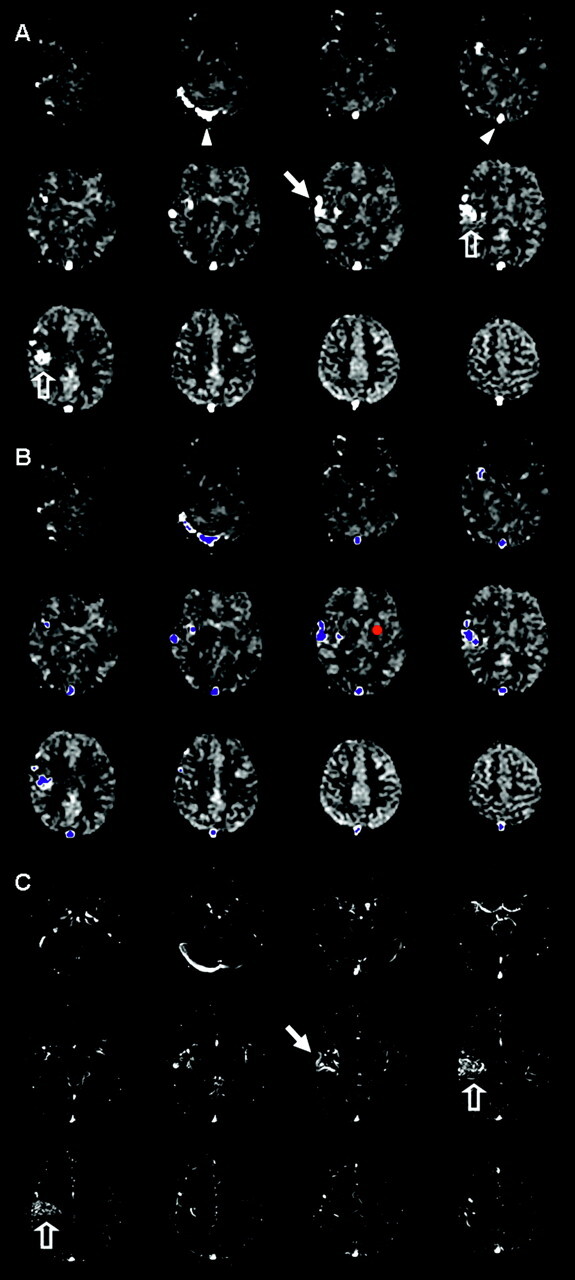
Fig 1.

Image evaluation and shunt approximation for a right hemisphere AVM. A, CASL perfusion ΔM maps show bright signal intensity in the sagittal sinus and right transverse sinus (arrowheads) and in draining veins (arrows) adjacent to the nidus (open arrows). B, A small region of interest (red circle) placed in the left basal ganglia is used for each patient to measure mean ΔM (BGmean) and SD (BGSD). A threshold is generated (empirically chosen as threshold = BGmean + 8 *BGSD) above which voxels are labeled as shunt voxels to create a mask (blue voxels) for the AVM and draining vessels. The AV shunt fraction is estimated by multiplying the mean ΔM in the mask by the number of voxels in the mask, then dividing by the mean ΔM in the entire brain multiplied by all labeled voxels. C, Registered 2D TOF MRA source images (no superior saturation band) are reviewed to verify reasonable selection of AVM and draining vessels (open and closed arrows).
