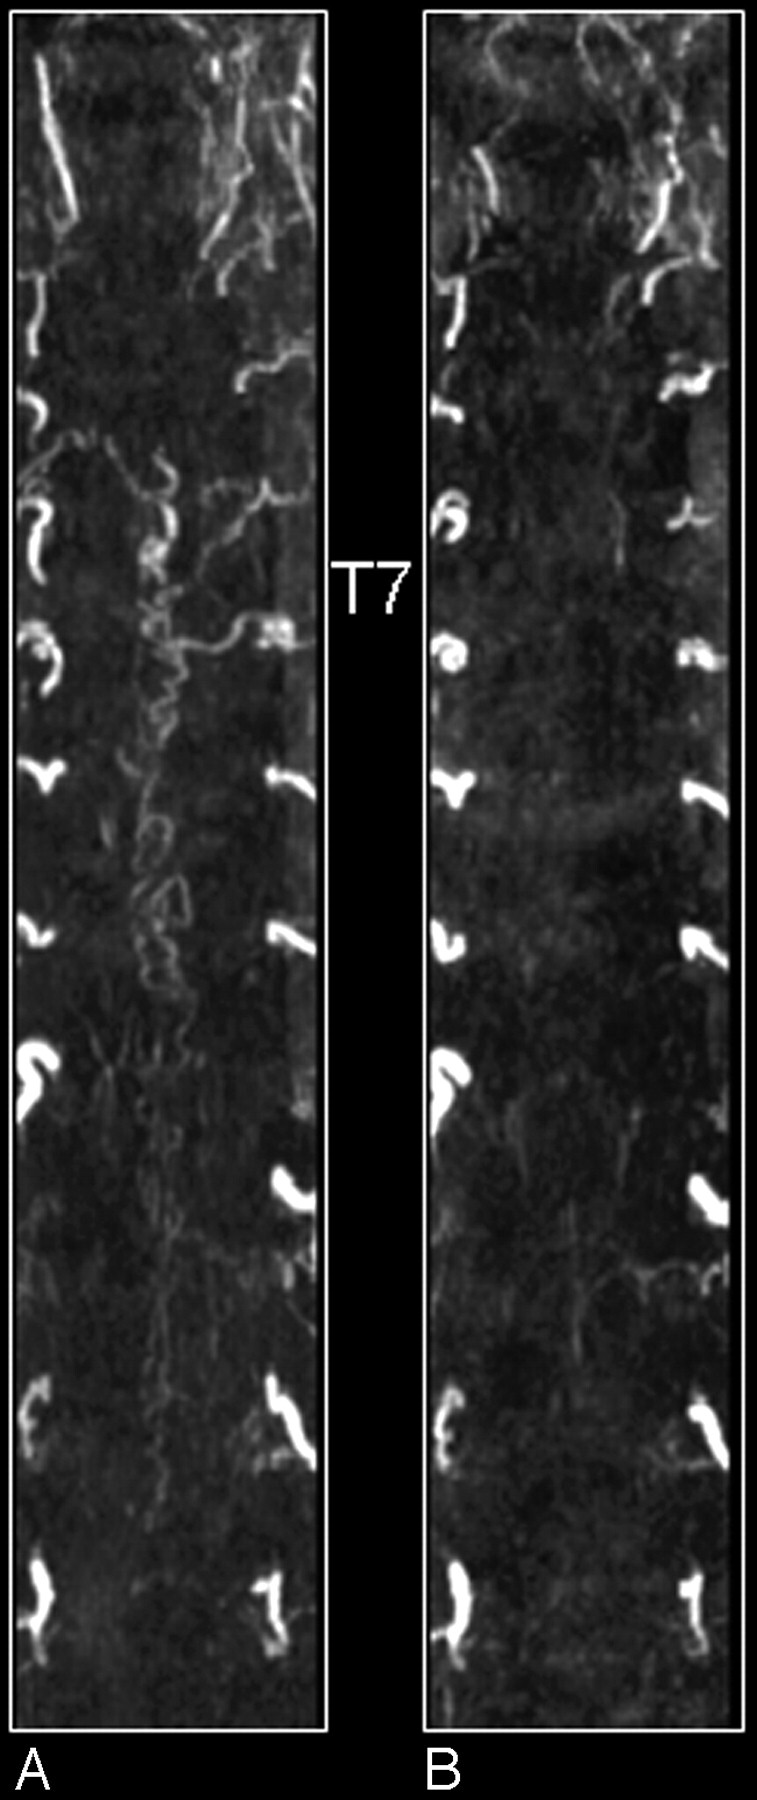
Fig 10.

MR angiography of a patient with an SDAVF before (A) and after treatment (B). Shown are coronal maximum intensity projections. Note on the first-phase MR angiogram the dilated tortuous veins and the arterial feeder at thoracic vertebral level T7 of the fistula (A). After treatment the tortuous veins are not visible anymore (B).
