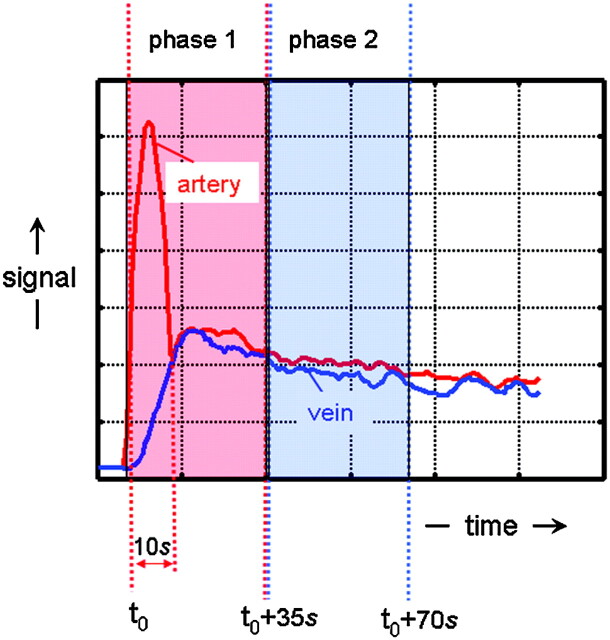
Fig 3.
Schematic representation of the temporal signal intensity changes of arteries and veins due to the bolus injection of an MR contrast agent and the sampling of k-space data. Due to the bolus injection of the contrast agent, a temporarily (∼10-seconds) distinct difference exists in signal intensity between arteries (red) and veins (blue). By accurately timing the start of a first-phase scan, the temporarily existing contrast between arteries and veins can be exploited by first sampling the center of k-space followed by the periphery. Because the contrast of an MR image is highly determined by the central k-space values, arteries will appear brighter than veins on the first-phase images. At the time the consecutive second-phase data are acquired, the signal intensity differences between arteries and veins have vanished in all parts of the k-space, which will provide images wherein arteries and veins appear equally bright.

