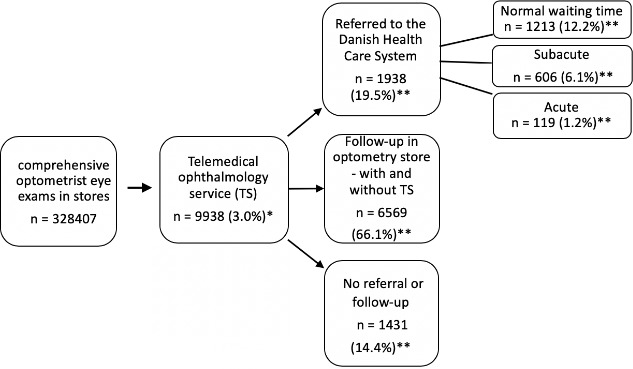
Figure 1.

Flow chart illustrating the patient journey. Number of patients (n). *Represents the percentage of patients included in the telemedical service (TS) (9938) from the pool of total number of comprehensive optometrist vision examination in store (328407). **Represents the percentage of patients undergoing further stratification in the TS for either referral (different categories), follow-up and no referral/follow-up from the total number of patients in TS (9938).
