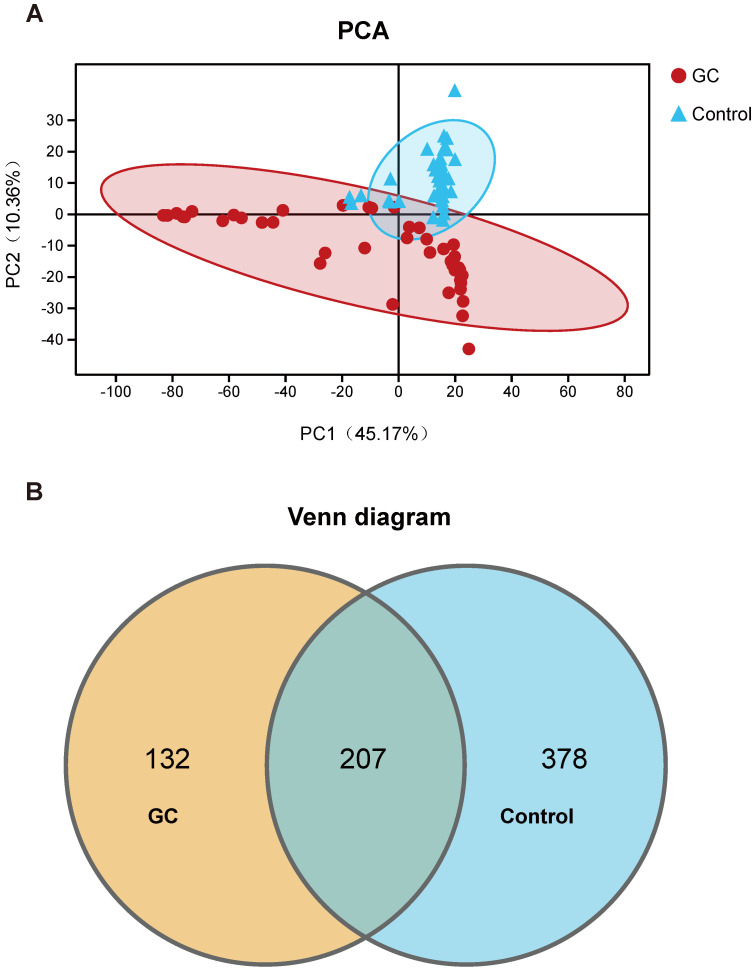
Figure 1.
Classification and distribution of fungi in the stomachs of gastric cancer (GC) patients. (A) Through the principal component analysis (PCA) dynamic display, GC (n=45) and control (n=45) samples showed clustering distributions. PC1 and PC2 represent the first two main components, and they reflect the contribution to the sample difference, expressed as a percentage. (B) Based on the OTU abundance, Venn diagram analysis was performed. Unique OTUs between the GC (orange) and control (blue) groups was found as well as common OTUs (lightcyan) between the two groups.

