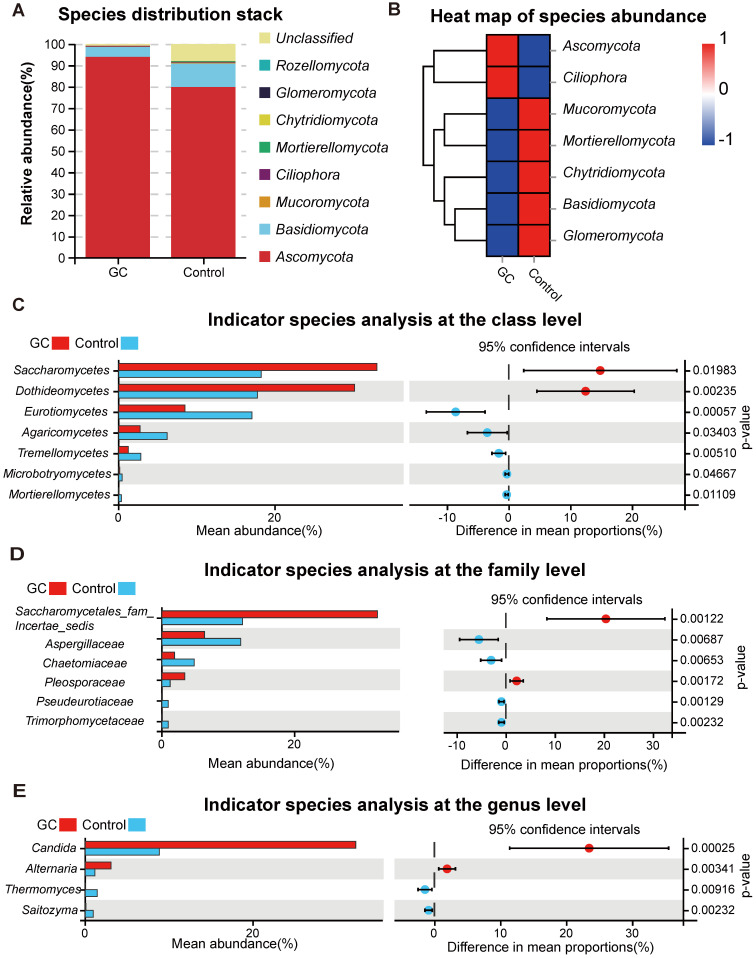
Figure 2.
Changes in the fungal composition in the stomachs of gastric cancer (GC) patients. (A) Relative abundance of dominant gastric fungal phyla in the GC and control groups. The dominant phyla were Ascomycota and Basidiomycota in both groups. (B) The corresponding heatmap also shows changes in the fungal phyla in the GC and control groups. Differences in fungal composition and abundance between GC (n=45) and the control (n=45) were detected using Welch's t test. The variation in the relative abundance of species represented in different groups was demonstrated graphically. Differences in OTUs appear in the left rows, and the corresponding P values are shown in the right rows. (C) Differentially abundant fungal classes between the GC and control groups. OTUs and taxa differences are shown with p-values less than 0.05. Differentially abundant fungal families (D) or genera (E) between the GC and control groups. OTUs and taxa differences are shown with p-values less than 0.01.

